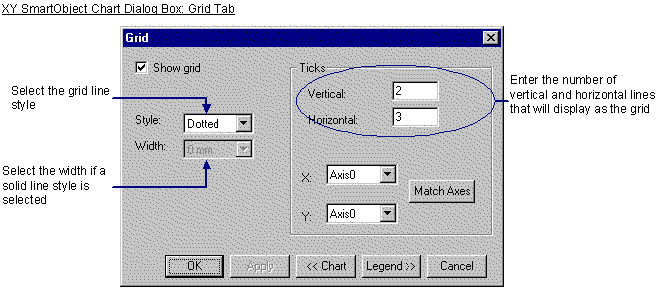
If your XY Plot Control will benefit by displaying a grid, you can easily configure one in the XY Plot SmartObject dialog box.

![]() To configure a grid for an XY Plot
SmartObject:
To configure a grid for an XY Plot
SmartObject:
Click Grid on the bottom of the Chart tab in the XY Plot SmartObject dialog box.
The Grid tab of the XY Plot SmartObject dialog
Check the Show Grid check box to display the grid on the XY Plot Control.
Select the Style from the Style drop down menu.
![]() Solid–Select the line width in the
Width drop down menu if you choose this option
Solid–Select the line width in the
Width drop down menu if you choose this option
![]() Dashed
Dashed
![]() Dotted (default)
Dotted (default)
![]() Dash Dotted
Dash Dotted
![]() Dash Double Dot
Dash Double Dot
Configure the grid's density.
Enter the number of vertical ticks (lines) that should display for the XY Plot Control grid in the Vertical field.
Enter the number of horizontal ticks (lines) that should display for the XY Plot Control grid in the Horizontal field.
Click Match Axes to display the two horizontal and two vertical grid lines.
|
About XY Plot SmartObject configuration. |