Because there are several parameters that may be the same for all your logging tables, the Database Logger provides you with the ability to specify defaults. The default you set will be the initial value a table uses. However, you can change the values for individual tables.
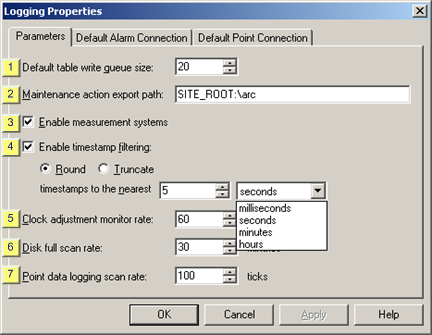
Select the Parameters tab in the Logging Properties dialog box.
|
Default table write queue size |
|
|
Maintenance action export path |
|
|
Enable measurement systems |
|
|
Enable timestamp filtering |
|
|
Clock adjustment monitor rate |
|
|
Disk full scan rate |
|
|
Point data logging scan rate |
|
1 |
Default table write queue size |
A queue size that supports the worst-case logging during activity bursts.
For example, if 10 points are being logged to the DATA_LOG table, you should have a queue size of at least 10 in case the points' logging conditions all occur simultaneously.
Guidelines
The default queue size is the size of the queue of logged data for each table in the Database queue size field.
![]() If the database queue for a table
overflows a message is logged to your project's Status Log
and additional write requests are dropped until there is room in
the queue for them.
If the database queue for a table
overflows a message is logged to your project's Status Log
and additional write requests are dropped until there is room in
the queue for them.
![]() If there is more logging than can
be supported by the benchmarked data rate for the database
increasing the size of the database queue will not resolve the problem of lost
data.
If there is more logging than can
be supported by the benchmarked data rate for the database
increasing the size of the database queue will not resolve the problem of lost
data.
![]() Increasing the size of the
Database Logger queue will increase the amount of memory
used by the database logger. Since each table pre-allocates memory
for the queue, this growth will take place at startup time. For
each additional entry in the queue, the following additional memory
will be used:
Increasing the size of the
Database Logger queue will increase the amount of memory
used by the database logger. Since each table pre-allocates memory
for the queue, this growth will take place at startup time. For
each additional entry in the queue, the following additional memory
will be used:
|
Alarm Log Table |
200 bytes per entry. |
|
Event Log Table |
200 bytes per entry. |
|
Data Tables |
Size of logged data plus 36 bytes. |
|
Group Tables |
Size of logged data plus 36 bytes. |
|
Database Logger Default: |
20 |
|
2 |
Maintenance action export path |
The system path to the directory that holds the files created by table maintenance export and purge actions in the, if it is different from the default.
|
Default |
SITE_ROOT:\ARC places the data into the ARC subdirectory of the project. |
Guidelines
You may use the logical directory name SITE_ROOT to specify a different subdirectory of your project, or use any other full path specification such as D:\EXPORT.
|
3 |
Enable measurement systems |
|
Checked |
Database Logger logs data for point values using the active measurement system converted value. |
Note: The Database Logger logs values for device points and virtual points are as follows:
|
Device points |
Checked and the measurement system is active |
Database Logger logs the data in the specified units. Note: You can also log the raw value for device points by checking Raw Value on the Log Attribute tab in a table's Properties dialog box. |
|
|
Clear or no measurement system is active |
Database Logger logs the EU converted value. |
|
Virtual points |
The database logger logs the derived value of the point. |
|
Example
If you configure a point to be in inches, if you are using a metric system and that point is showing as centimeters, the Database Logger is still going to log it as inches unless you check Enable Measurement Systems.
|
4 |
Enable timestamp filtering |
|
Checked |
Limits the number of characters in a table's timestamp column. You can choose to either round or truncate the timestamp. |
|
|
|
Default |
Clear |
Option 1–Rounding up or down
Check Round to round the actual time is rounded in the timestamp to the nearest specified number of units.
Enter the nearest number and unit to which the timestamp will be rounded in the timestamps to the nearest fields.
Example
You specify that timestamps be rounded to the nearest 5 seconds.
The time is 10:50:22:05. It will be rounded to 10:50:20.
The time is 10:50:24:05. It will be rounded to 10:50:25.
Option 2–Truncating
Check Truncate to truncate the actual time in the timestamp to the nearest specified unit.
Enter the unit to which the timestamp will be truncated.
Example
You specify that timestamps be truncated to seconds.
The time is 10:50:22:05. It will be truncated to 10:50:22.
The time is 10:50:24:55. It will be truncated to 10:50:24.
|
5 |
Clock adjustment monitor rate |
Rate (in seconds) at which system clock adjustments are checked. All synchronized timed events are adjusted when a system clock adjustment occurs.
|
Default |
60 |
Valid values from 1 through 3600.
|
6 |
Disk full scan rate |
An interval (in minutes) the Database Logger should wait between disk scans.
|
Default |
30 |
Guidelines
The Database Logger scans the disk at intervals to determine if it is full. The Disk full scan rate (min) determines how long the Database Logger waits after completing one scan before it scans the disk again.
The default for the Disk full scan rate affects tables for which you have enabled Disk Space Low maintenance event.
Note: The Disk Full condition is only useful for Microsoft Access databases. The SQL Server forces pre-allocation of disk space for data tables.
|
7 |
Point data logging scan rate |
A value in ticks (100 ticks=1 second) in the Point data logging scan rate field that is:
![]() Faster than the fastest table scan
rate in ticks at which the Point Data Logger will submit data for
logging.
Faster than the fastest table scan
rate in ticks at which the Point Data Logger will submit data for
logging.
![]() Large enough so that all the data
for a PLC scan comes into the database together.
Large enough so that all the data
for a PLC scan comes into the database together.
|
Default |
100 |
Guidelines
The Point Data Logging scan rate is the rate at which the Point Data Logger submits data for logging.
Result: The pathname you enter is validated when the Parameters tab is closed.
|
|
Database Logger default logging properties. |