You can choose to display control lines on your chart in the SPC Control Properties dialog box.
Select the Lines tab.
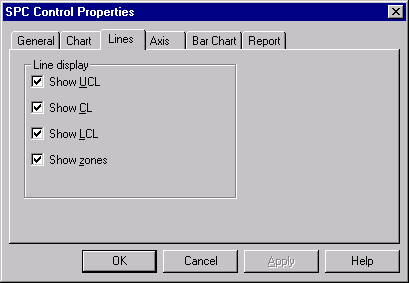
Check boxes to show lines on your chart, or clear boxes to hide lines. Lines display as follows:
|
Show UCL |
Displays upper control limit line. |
|
Show CL |
Displays center line. |
|
Show LCL |
Displays lower control limit line. |
|
Show zones |
Displays zone lines. Note: Show zones is no enabled for Moving range. |
|
|
Configure an SPC chart in CimEdit. |