|
Set criteria. |
|
|
Perform variable control tests. |
Set criteria
SPC plots the averages of the samples you define on XBar charts in the XBar-R and XBar-S chart sets. It is the XBar charts that display the zone in which these averages fall. At runtime, each subgroup that meets one or more of the selected test criteria will be displayed with a special character (the default is a red asterisk).
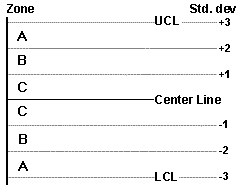
The following zones are used in these tests:
![]() Zone C is the area up to
one standard deviation from the center line.
Zone C is the area up to
one standard deviation from the center line.
![]() Zone B is the area between
one and two standard deviations from the center line.
Zone B is the area between
one and two standard deviations from the center line.
![]() Zone A is the area between
two and three standard deviations from the center line.
Zone A is the area between
two and three standard deviations from the center line.
Performing multiple control tests:
In the Alarm tab of the Variable Quality Characteristics Properties dialog box, you can run multiple control tests on your data by checking the appropriate boxes. At runtime, each data value will be compared with all of the selected alarm conditions and plotted on your configured SPC chart. When you position your cursor over the red asterisk (default character), a detailed tool tip will display with the date, time, point value and failed test data, i.e. the control test number(s).
![]() Note: When you create a control chart,
you can select samples for exclusion.
Note: When you create a control chart,
you can select samples for exclusion.
The following example depicts the standard:

Perform variable control tests
Check the appropriate box in the Alarms tab for each of the tests to be performed.
View test results by:
![]() Accessing a configured SPC
chart to view runtime data, or
Accessing a configured SPC
chart to view runtime data, or
![]() Configuring a new SPC
chart.
Configuring a new SPC
chart.
Click the buttons below to view information on Control Tests.
|
Control Test 1 |
One Subgroup Beyond Upper or Lower Limits |
|
|
Control Test 2 |
N Subgroups in a Row on Same Side of Center Line |
|
|
Control Test 3 |
N Consecutive Subgroups in a Row all Increasing or Decreasing |
|
|
Control Test 4 |
N Subgroups in a Row, Alternating Up and Down |
|
|
Control Test 5 |
M out of N Subgroups in a Row in Zone A or Beyond (Same Side of Center) |
|
|
Control Test 6 |
M out of N Subgroups in a Row in Zone B or Beyond (Same Side of Center) |
|
|
Control Test 7 |
N Subgroups in a Row in Zone C, Above or Below Center |
|
|
Control Test 8 |
N Subgroups in a Row Beyond Zone C, Above or Below Center |
|
Exclude/return samples in Control Chart calculation. |
|
|
Step 3. Add and configure variable quality characteristics. |