The Histogram shows you the distribution, the central tendency and the scatter or variability of the sample data. This chart also displays the calculated process capability for the data.
There are two process capability measurements displayed by this chart, Cp and Cpk. Depending on whether the source of the data
is an XBar-R or XBar-S chart, the estimate of the process standard deviation differs.
For XBar-R data, the estimate of the process standard deviation is:
![]()
For XBar-S data, the estimate of the process standard deviation is:
![]()
Capability Index
Cp is the capability index defined as the tolerance width divided by the process capability, irrespective of process centering.
For XBar-R data, it is calculated as:
![]()
For XBar-S data, it is calculated as:
![]()
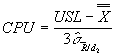
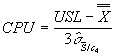
Capability Index for Process Centering
Cpk is the capability index which accounts for process centering and is defined as the minimum of the upper and lower capability
indexes. It relates the scaled distance between the process mean and the closes specification limit to half the total process spread.
For XBar-R data, the upper and lower indexes are calculated as:
 and
and 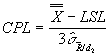
For XBar-S data, the upper and lower indexes are calculated as:
 and
and 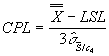
|
|
Histogram Z values. |
|
|
SPC chart calculations. |