The EWMA chart facilitates detecting out-of-control situations very quickly. EWMA charts incorporate information form all previous subgroups, with the information from the closest subgroup with a higher weight. An out-of-control decision is made with data from previous subgroups, as well as the current subgroup.
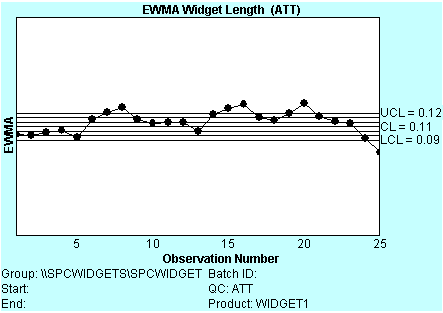
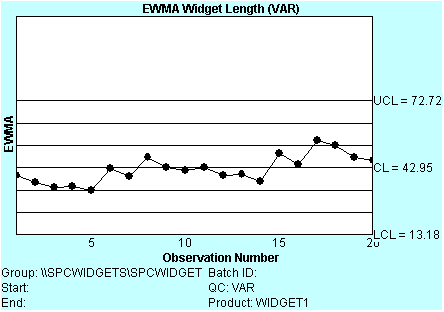
The following is are examples of EWMA charts for an attribute and variable that were created using the SPC ActiveX Control.
|
Attribute |
|
|
Variable |
Subgroup = 1
Subgroup = 1
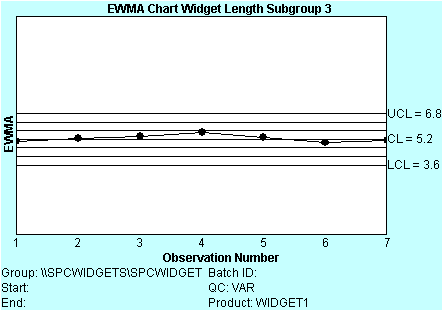
Subgroup = 3
![]() Exponentially Weighted Moving
Average (EWMA) chart calculations.
Exponentially Weighted Moving
Average (EWMA) chart calculations.
![]() SPC chart types.
SPC chart types.