Moving range charts display the difference between each successive pair of readings (e.g., difference between the first and second reading, the second and third, etc.). There will be one less moving range than there are individual readings (25 readings give 24 moving ranges).
The following is an example of a Moving Range chart that was created using the SPC ActiveX Control
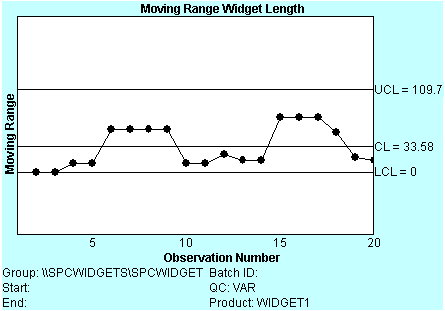
![]() Moving range chart
calculations.
Moving range chart
calculations.
![]() SPC chart types.
SPC chart types.