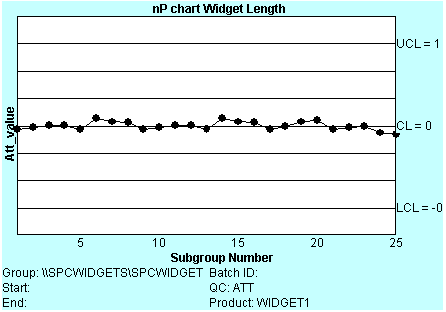
The nP chart measures the number of nonconforming items in an inspection lot. It is identical to p chart except that the actual number of nonconforming items is plotted, rather than their proportion of the sample. The inspection sample sizes must be equal in this case.
The following is an example of an nP chart created using the SPC ActiveX Control:
![]() nP chart calculations.
nP chart calculations.
![]() SPC chart types.
SPC chart types.