The P chart measures the proportion of nonconforming (discrepant or defective) items in a group of items being inspected. Proportion is defined as the ratio of the number of nonconforming items in a population to the total number of items in that population. Sample sizes do not have to be equal.
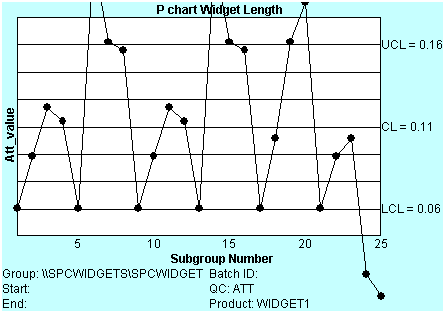
The following is an example of a P chart created using the SPC ActiveX Control:
