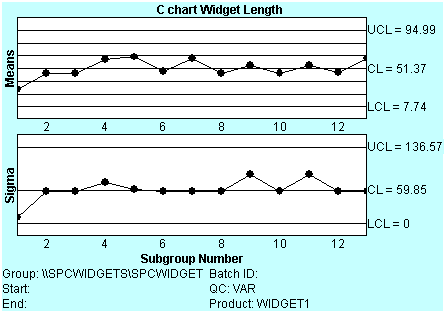
The XBar-S chart displays two charts, one for the XBar values and the other for the Sigma values.
The following is an example of an XBar-S chart created using the SPC ActiveX Control.
More information
XBar-S chart calculations.
SPC chart types.