|
Process Statistics |
Description |
|
CPU Usage |
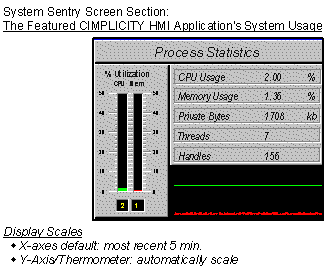
Displays in three locations, the bar chart, text display and the trend chart. The CPU Usage is directly related to activity within the physical process. For example, when a conveyor system starts, we should expect an increase in CPU Usage as device points start changing and pass through the system |
|
Memory Usage |
Displays as a percent of system memory. Because it is a ratio, this number will change as other applications open and close on the system. However, when the system is in a steady state this counter easily identifies where the memory is being used. A more accurate measure of memory usage is Private Bytes. This counter shows the amount of memory in Kilobytes being used by the process. In general, private bytes should remain constant for a process that is in a constant state. |
|
Threads |
Indicates the number of operating system threads active in the process. This number should be static for most processes except Event Manager and CimView. |
|
Handles |
Indicates the number of operating system handles in use by the process. This number may increase or decrease. However, the number should not constantly increase without bounds. If it does, it may indicate a software problem. |
|
Frequently used features on System Sentry screens. |