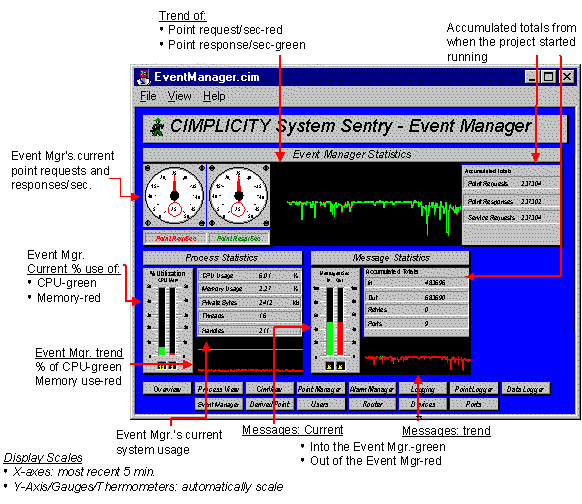
The Event Manager process, configured through the Event Editor, runs actions in response to system events. These actions can be simple set points or user written Basic Control Engine Scripts. The Basic Control Engine User Interface (BCE User Interface) can be used to obtain a detailed view of event processing within the Event Manager.
This Event Manger Screen provides a measurement of how the Event Manager process is performing.

![]() Guidelines for using the Event Manager screen
include:
Guidelines for using the Event Manager screen
include:
![]() Review Point Requests/Sec for the number of
requests being sent to the Point Manager per Second. The Event
Manager point requests are one of the following:
Review Point Requests/Sec for the number of
requests being sent to the Point Manager per Second. The Event
Manager point requests are one of the following:
![]() Set points that are issued by the
Event Manager or your script
Set points that are issued by the
Event Manager or your script
![]() Requests to read a point value
(through the BCE PointGet command.)
Requests to read a point value
(through the BCE PointGet command.)
This counter is directly dependent on your Event Manager application.
![]() Check the CPU Usage to see how much processing
time the Event Manager is using. Typically, this value will not be
steady. Instead, it should reflect the processing performed by the
Event Manager when it has work to do.
Check the CPU Usage to see how much processing
time the Event Manager is using. Typically, this value will not be
steady. Instead, it should reflect the processing performed by the
Event Manager when it has work to do.
In a typical application, the CPU Usage should drop to zero periodically. This indicates that there is enough CPU bandwidth for the Event Manager to complete its work in response to factory events. An Event Manager that never idles, is an Event Manager that is constantly busy and prone to fall behind in event processing.
![]() If you see a large spike in
CPU Utilization along with
a large spike in Point
Requests/Sec check to see if a script is polling a point
value in a loop with little or no delay.
If you see a large spike in
CPU Utilization along with
a large spike in Point
Requests/Sec check to see if a script is polling a point
value in a loop with little or no delay.
To correct the spikes:
Identify the script though the BCE UI.
Correct the logic in the script to use the On Change notification as opposed to busy polling.
Polling is a drain on system resources and will prevent you from getting the best performance from your project.
![]() Note: The performance data for the
Basic Control Engine includes all scripts that are run under the
control of the Basic Control Engine.
Note: The performance data for the
Basic Control Engine includes all scripts that are run under the
control of the Basic Control Engine.
|
System Sentry screens list. |