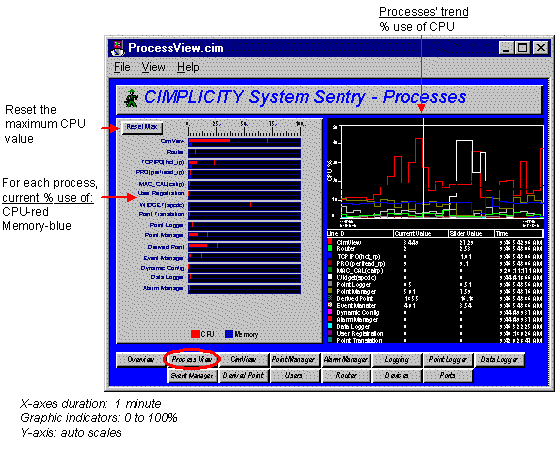
The Process screen displays information about each CIMPLICITY process in the project being monitored.

![]() Guidelines for reading the Processes screen
include:
Guidelines for reading the Processes screen
include:
![]() Use the CPU utilization views for each process,
particularly when you suspect excessive CPU utilization and need to
determine which process, or processes, is causing it.
Use the CPU utilization views for each process,
particularly when you suspect excessive CPU utilization and need to
determine which process, or processes, is causing it.
Views include:
![]() A Max Capture for CPU Utilization on the
bar chart. The Max Capture indicator shows the highest reading
since the screen has been open.
A Max Capture for CPU Utilization on the
bar chart. The Max Capture indicator shows the highest reading
since the screen has been open.
To track when a process is using excessive memory:
Leave the screen open for a period of days to capture the spikes.
Click the Max line at regular intervals to display the date and time at which maximum utilization occurred.
Example

![]() A one minute trend chart that
provides a graphic comparison of the percent CPU utilization by
each process.
A one minute trend chart that
provides a graphic comparison of the percent CPU utilization by
each process.
![]() The actual percent CPU utilization currently and
at the trend chart slider, for each process.
The actual percent CPU utilization currently and
at the trend chart slider, for each process.
![]() Check each process' Memory Utilization as a percent of
available system memory on the bar chart if the system is running
low on memory. This can help you determine which process, or
processes, is using the memory.
Check each process' Memory Utilization as a percent of
available system memory on the bar chart if the system is running
low on memory. This can help you determine which process, or
processes, is using the memory.
If any you require more information for any process, click its button at the bottom of the screen. A screen dedicated to that process will open.
|
System Sentry screens list. |