In addition to selecting a line's color, you can give it a unique appearance by selecting a solid or non-solid style, the curve type and if the line will display during runtime.
Select a line in the Lines grid.
Click .
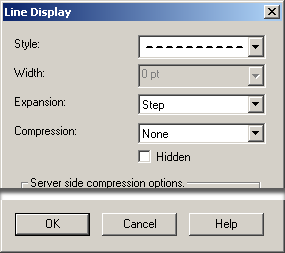
The Line Display dialog box opens.
The top half of the dialog box provides fields to select the line display.
Configure the line as follows.
|
Field |
Description |
|
|
Style |
Select Solid or one of a variety of dot/dash lines in the drop-down list. |
|
|
Width |
(Available when a solid line is selected) Line width in points. |
|
|
Expansion |
How the points should be connected. The choices are |
|
|
|
Step |
(Recommended for runtime display) Connects data points with a stepped line |
|
|
Smooth |
Connects data points with a straight line. The legend will always display the last actual value to the left of the cursor. That is, the value in the legend does not reflect the line interpolation. |
|
HIdden |
Checked |
The selected line does not display during runtime. |
|
|
Clear |
The line selected displays during runtime. |
|
|
Color and Font Choices on a Trend Chart. |
|
|
Step 5. Specify Line Display Features. |