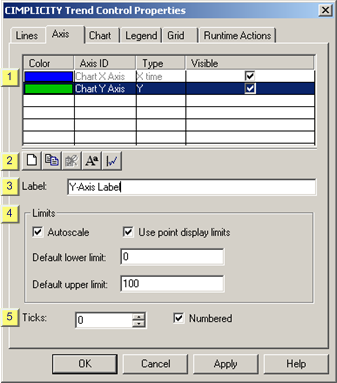
Select a Y-axis on the Axis tab in the CIMPLICITY Trend Control Properties dialog box.
Y-axis options are as follows.
|
Axis list |
|
|
Axis tab toolbar |
|
|
Label |
|
|
Limits |
|
|
Ticks/Numbered |
|
Axis list |
Axes that have been created for the Trend Control are listed in the Axis tab grid.
The following specifications can be made in the grid.
|
Feature |
Description |
|
|
Color |
Change the default color applied to the line. Click the button to the right of the selected line to open the Color palette. |
|
|
Axis ID |
ID that identifies the axis during runtime. The Axis ID is Read Only. |
|
|
Type |
Line type is either X time or Y. |
|
|
Visible |
Checked |
The axis is visible on the control during runtime. |
|
|
Clear |
The axis is not visible on the control during runtime. |
|
Axis tab toolbar |
The following toolbar buttons are available on the Lines tab.
![]()
|
A |
Opens a New Axis dialog box. |
|
B |
Enter a name for the new axis. The new axis has the same configuration as the copied axis; the configuration can be modified. |
|
C |
Deletes a selected axis. Note: The Chart X Axis and Chart Y Axis cannot be deleted. |
|
D |
Opens the Font dialog box. |
|
E |
Opens the Line-Axis Mapping dialog box. |
|
Label |
Axis title.
|
Limits |
Limits options include the following.
|
Option |
Description |
||
|
Autoscale |
Checked |
Trending automatically changes the Y-axis limits each time a value goes above or below the existing limit. |
|
|
|
Clear |
Y-axis uses the same scale even if a value goes above or below the existing limit. |
|
|
Use point display limits |
Checked |
Trending use the point's limits specified in the Configuration–Point dialog box. If Trending can't find limits in the Configuration–Point dialog box, it will use the values you enter in the Default lower limit and Default upper limit fields. |
|
|
|
Clear |
Point limits are not used. |
|
|
Limits |
Limits can be specified as follows. |
||
|
|
Default lower limit |
If there are no point limits, the Y-axis changes each time a value goes above the default lower limit. |
|
|
|
Default upper limit |
If there are no point limits, the Y-axis changes each time a value goes above the default upper limit. |
|
Autoscale functions as follows:
The highest and lowest values are found from all lines associated with the axis.
The decimal base is calculated for both highest and lowest values.
Examples
The decimal base of 150 is 100.
The decimal base of 7654 is 1000.
The high limit is the number closest to the highest number on the high side, using the calculated decimal base from the highest value as multiple.
The low limit is the number closest to the highest number on the low side, using the calculated decimal base from the lowest value as a multiple.
Example
Given 478 and 7891 as the lowest and highest values found, the calculated low and high limit for the axis is 400 and 8000. This is because 400 is the closest value to 478 on the low side that uses a multiple of 100 and because 8000 is the closest value to 7891 on the high side that uses a multiple of 1000.
![]() Guidelines for the order of priority if you select
all the limit options
Guidelines for the order of priority if you select
all the limit options
Trending:
Increments the upper or lower limit each time a value goes above or below the existing limit.
Uses the limits specified in the Points – Configuration dialog box.
Uses the limits specified in the Default lower limit and Default upper limit fields.
|
Ticks/Numbered |
Specify the following.
|
Option |
Description |
|
|
Ticks |
Number of ticks that the X-axis should display. |
|
|
|
Minimum |
0 |
|
|
Maximum |
99 |
|
Numbered |
Check |
The tick marks will be labelled. |
|
|
Clear |
The tick marks will display with no labels. |
|
|
Option 6.2. Configure the Y-axis. |