When you are working with the DGR, point values that display in either live or DGR mode display on runtime applications.
|
Example: CimView |
|
|
Example: Trend chart |
Example: CimView
Create a CimEdit screen with point ID's that need to be reviewed.
Add objects that will display point values for points that are being logged through the CIMPLICITY default logging.
Start the CIMPLICITY project.
Run the CimView screen.
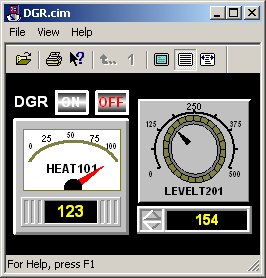
Result: CimView displays the following.
|
DGR mode |
CimView displays |
|
Live or not started |
Real time values. |
|
Historical playing |
Logged data values. |
Example: Trend Chart
Configure a Trend chart on a CimEdit screen with point ID's that need to be trended.
Start the CIMPLICITY project.
Run the Trend.
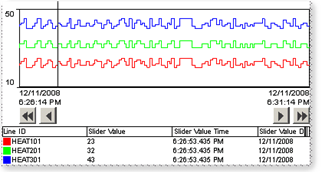
Result: The Trend chart displays the following.
|
DGR mode |
CimView displays |
|
Live or not started |
Real time values. |
|
Historical playing |
Logged data values. |
|
|
Configuration for DGR use. |