If you would like to add a new connection to the list, see Configuring Connection Properties.
To search a SCADA server:
- Select the Type of data you want to search for. The options are Alarms orTrends.
- Type in a Tag, Cluster or Comment filter to help refine the search results. Be aware that if the type selected is Alarm, the Comment filter will not be available.
-
The filters have basic wildcard and Boolean search functionality. You can use the keywords AND, OR and NOT with wildcard strings, as well as group Boolean terms using parentheses. Searches are not case sensitive.
For example, entering "L*" in the Tag Filter returns tags beginning with the letter "L" in every cluster. Entering "L* OR H*" will find tags beginning with "L" or "H". More complex examples include "L* OR (H* AND NOT *G). This would return tags that start with "L" or any that start with "H", but do not end in "G".
If you leave a field blank, each item of the selected type will be retrieved.
- Click Search. The results are returned in the Search results list.
-
In the case of a SCADA connection, the results are not sorted: the tags appear in the order they were configured in CitectSCADA. The cluster associated with each tag is also displayed. The Process Analyst displays only the tags in clusters that this client has access to. In a system with more than one cluster, if a tag is not configured with a cluster, it is listed once for each cluster.
To search a Historian server:
- Select the Type of data you want to search for. The options are alarms or trends.
- Type in a Tag filter to help refine the search results. In the case of a Historian Server, the filter allows you to apply a basic wildcard search against the full path for each attribute, as defined by its location within the Published Items directory.
-
The following example shows how wildcards can be used to search a path and attribute name.
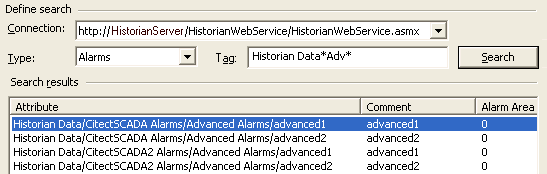
If you leave the field blank, published attributes of the selected type will be retrieved.
- When you click Search, the results are returned in the Search results as a list of attributes. Their properties are displayed, and their location within the Published Items directory is defined as a path.
- Comment- applies the tag comment as the pen name. If the tag does not have a comment specified, a name is automatically generated.
- Tag- applies the tag name as the pen name.
- Auto-applies an automatically generated name to the pen using the format Pen<X> where X is an incremented number, starting with the first available number.
Note: To remove a tag from the Selected Items list, highlight the item you want to move, and then click Remove.