 , it will tend to form a
pattern. The pattern is referred to as a probability distribution
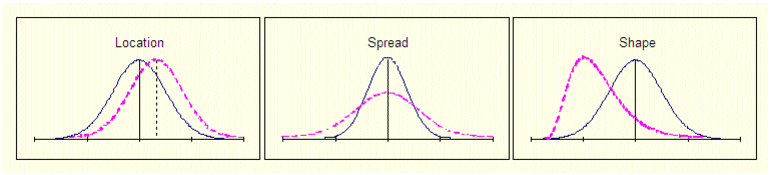
and is characterized in three ways:
, it will tend to form a
pattern. The pattern is referred to as a probability distribution
and is characterized in three ways:To use SPC effectively, understand the concept of variation. When a product characteristic is measured repeatedly, each measurement is likely to differ from the last. This is because the process contains sources of variability.
When the data is grouped into a frequency
histogram, it will tend to form a
pattern. The pattern is referred to as a probability distribution
and is characterized in three ways:
Note: Most SPC techniques assume that the
collected data has a normal
distribution.
Variation is generally categorized into one of two types:
Statistics indicate that common variations account for about 85% of departures from process quality requirements. Usually these departures require solution at the management level.
Statistics indicate that special variations account for about 15% of departures from process quality requirements. Typically these departures require local action (equipment repair and so on) for solution.
See Also