 ):
):The SPC calculations are based on the samples collected in subgroups. Each subgroup will have the same number of samples, typically 4. The subgroup size for each SPC tag is set at the SPC Tags properties form.
The number of samples in each subgroup can range from 1 to 25 inclusive.
When the number of samples in each subgroup is 1
Subgroup Mean ():
is the value of the single sample in the group, and is defined by:

Where  is the single
sample value in the subgroup.
is the single
sample value in the subgroup.
Moving Range (MR):
is the difference between successive sample values, and is defined by:
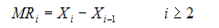
Where is the current
sample value and  is the previous
sample value. The number of moving ranges in the process is always
one less than the number of subgroups.
is the previous
sample value. The number of moving ranges in the process is always
one less than the number of subgroups.
Subgroup Standard Deviation (s):
is a measure of absolute variation or dispersion. It describes how much the sample values differ from their mean, and is estimated by:
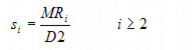
The number of subgroup standard deviations in the process is always one less than the number of subgroups.
Process Average ( ):
):
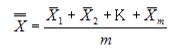
Where  ,
,  , and
, and  are the
subgroup means, and m is the total number of subgroups in the
process.
are the
subgroup means, and m is the total number of subgroups in the
process.
Process Range ( ):
):
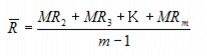
Where MR2, MR3, and MRm are the subgroup moving ranges, and m is the total number of subgroups in the process.
Process Standard Deviation ( ):
):
When the number of samples in each subgroup is greater than 1
Subgroup Mean ():
is the average (not median or center) of the samples in the group, and is defined by:
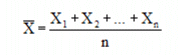
Where X1, X2, and Xn are the sample values in the subgroup, and n is the total number of samples in the subgroup.
Subgroup Range (R):
is the difference between the highest and lowest samples in the group, and is defined by:
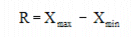
Where Xmax is the maximum sample value and Xmin is the minimum sample value in the group.
Subgroup Standard Deviation (s):
is a measure of absolute variation or dispersion. It describes how much the sample values differ from their mean, and is defined by:
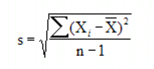
Where X's are the sample values in the group,
is the group average, and n is the
number of samples in the group.
Process Average ():
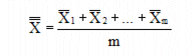
Where , , and are the
subgroup averages, and m is the total number of subgroups in the
process.
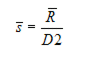
Process Range ():
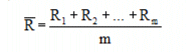
Where R1, R2, and Rm are the subgroup ranges, and m is the total number of subgroups in the process.
Process Standard Deviation ():
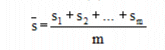
Where s1, s2 and sm are the group standard deviations, and m is the total number of groups in the process.
Average Control Limits (UCLx and LCLx):
Specify the approximated 3-sigma boundaries. For a normal distribution 99.74% of the samples will fall within this boundary.
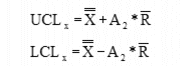
Where is the Process
Range and A2 is a constant (given in the Control Chart
Line Constants table).
Range Control Limits (UCLR and LCLR):
Specify the approximated 3-sigma boundaries. For a normal distribution 99.74% of the samples will fall within this boundary.
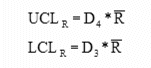
Where is the Process
Range and D3 and D4 are constants (given in
the Control Chart Line Constants table).
Standard Deviation Control Limits (UCLs and LCLs):
Specify the approximated 3-sigma boundaries. For a normal distribution 99.74% of the samples will fall within this boundary.
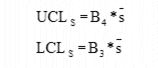
Where is the Process
Standard Deviation and B3 and B4 are
constants given in the Control Chart Line Constants table).
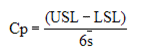
Process Capability (Cp):
Is the capability of a process to meet a specific tolerance. A process is considered capable when the percentage of samples of a variable for that process that fall within the upper and lower specification limits is greater than a specified value.
The inherent process capability is defined as:
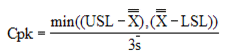
The process capability based on worst case data is defined as:
Skewness (Sk):
Is the degree of asymmetry of a frequency distribution (usually in relation to a normal distribution).
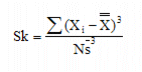
where N is the number of samples for the entire process (i.e. Subgroup Size * number of Subgroups).
Kurtosis (Ku):
Is the degree of peakedness of a frequency distribution (usually in relation to a normal distribution).
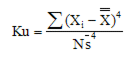
where N is the number of samples for the entire process (i.e. Subgroup Size * number of Subgroups).