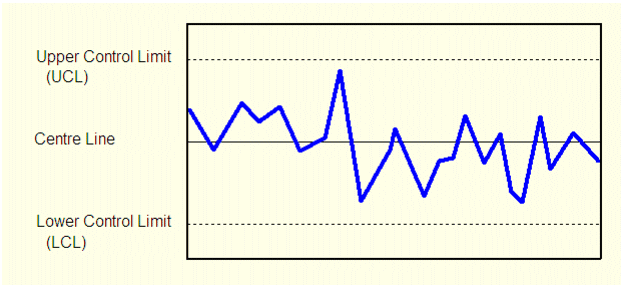
XRS charts are the primary tool of SPC and convey information about variation and controllability. The charts are trend graphs that individually show mean (X bar), range (R), and standard deviation (s or sigma). Each point on the graph represents sub-grouped data, not individual samples.