The chart is entered in a logical grid. All objects are snapped to the grid. You can use the commands of the View menu for displaying of hiding grid lines. The (x,y) coordinates of the mouse cursor are displayed in the status bar. This helps you locating errors detected by the compiler, or aligning objects in the chart.
At any moment you can use the commands of the View menu for zooming in or out the edited chart. You also can press the [+] and [-] keys of the numerical keypad for zooming the diagram in or out.
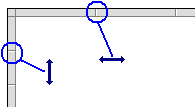
You also can drag the separation lines in vertical and horizontal rulers to freely resize the cells of the grid:
The SFC editor adjusts the size of the font according to the zoom ratio. When cells are wide enough, a text overview with the contents of the step or transition (level 2). The last button of the toolbar enables you to switch between possible displays:
| Swap
between possible overviews of level 2 in the level 1 chart: - display code of actions and conditions - display notes attached to steps and transitions |