|
from CitectSCADA
Presented by: Martin Roberts
Abstract This paper details how to get the best performance out of your CitectSCADA system.
Contacts support@citect.com Contents
Getting the Best Performance out of CitectSCADA
When you are implementing Citect with your whole SCADA system you usually are in one of two different situations.
The first situation is where you have the luxury of building the whole system from nothing. In this case you get the option of deciding what types of Hardware, IO Devices, Communication methods and all the other items you will need for the system. You will have the possibility of designing and implementing a really High Performance system.
The other situation is where you have been given the task of putting Citect into an existing system. You may or may not have the ability to change any of the existing system. In this case you will be limited to working with, and getting the best performance out of the equipment you already have installed.
If you are building a totally new system, you will find that there will be very little, and most likely nothing, you will have to do to Citect to make it perform at its maximum capacity. If you are adding Citect onto an existing system, then depending on that system and how well it was designed originally you may or may not have to modify some of Citects default parameters. Fortunately for you, there are many parameters that can be tweaked in order to try and get better performance. There are also many different diagnostic tools built into Citects Kernel.
These will be discussed later in this document.
Planning for a High Performance System
Historically, and even with todays Ethernet capable PLCs, the bottleneck in any Citect system is the turnaround time when Data is requested from your PLC. This delay in communications is the single most important factor to take into consideration if you are hoping to create the fastest, best performing Citect system you possibly can.
As a general rule, if you design your Hardware, PLC code and the data structures to enable fast efficient communications, you will have no problems with Citect. You will not need to tweak any of the many, many parameters available within Citect. You may still tweak them if you really want to, but you will probably only end up with a 1-2% increase in performance. This is because you have no real physical hardware or PLC related limitations that you need to cover up.
There is quite a lot of data that you should first gather regarding the IODevices that you wish to use to create your High Performance System. You will, of course, need to get something that can fulfil your actual process requirements. This decision is way outside the scope of this article.
You should get some data sheets or specifications regarding the PLC you want to use from the manufacturer.
These items are the ones that will be important for Citect.
· Communication Methods · Actual response time of the PLC for data requests · Protocol supported · Number of communication ports for each method · Method the PLC uses for servicing communication requests.
These are items that will have a definite impact on the overall performance of your Citect system and are discussed in more detail below. All of these factors will have an impact on the overall communications response times from your PLC.
|
||||||||||||||||


|
Transmission Type
|
Approximate Bits Per Second |
Bytes to Transfer |
Approximate Time to transfer |
|
Serial 9600 |
10,000 |
10 |
10 Milliseconds |
|
Serial 19200 |
20,000 |
10 |
5 Milliseconds |
|
Ethernet |
10,000,000 |
10 |
0.01 Milliseconds |
So you can see that from doubling your BAUD rate from 9600 to 19200 you gained 5 Milliseconds. By then multiplying your transmission speed by a factor of 500 you gained nearly 5 milliseconds.
A much more important factor is the actual response time of the PLC supported.
Actual response time of the PLC for data requests
This can be very difficult information to get. It is fairly doubtful that someone who is trying to sell you a PLC will tell you that it has a long response time. This information should be available with the specifications of the PLC. If not try and get the answer out of the manufacturer, otherwise you can use Citect to check this out. You can get accurate response times directly from the Kernel, although these times are more from the point of view of Citect. They typically measure the complete round trip time between Citect asking for data and getting the response packet.
If you can find out how long the PLC should take to process data requests and you can see in Citect the response times, you can then work out the time delay that is being produced by any other factors, such as cabling, interface cards etc.
This is probably the most important item of data you need. If the PLC you are looking at takes a long time to process request for data, then nothing you ever do in Citect will make your system faster. If the PLC can process and respond to requests for data within 1-2 ms or less then you will be well on the way to a very fast system.
This is typically tied directly to the actual Scan Time of the PLC. This will probably increase as your program grows larger. Some PLCs will allow you to set a scan rate that they will stick to, others will run as fast as they can .
The impact that this time will have on your system is illustrated in this simple example;
If your PLC has a scan time of 100ms, and it services communications request at the end of each scan. Then you will get an average time of 50ms for the period between the PLC receiving the request for data and sending the response. The actual time for each request will depend on how far the PLC is through its Scan when the request arrives. If it is near the end of the scan, the request may only wait 1-2 ms, if it has just started a new scan then the request may wait for 98-99 ms.
Protocols Supported
This is fairly important. Some protocols will allow larger packets of data to be transferred in one packet than others. As an example some protocols are limited to 224 bits per packet. Some protocols allow you to transmit 2048 bits per packet. So if you are using the first protocol that only supports 224 bits per packet it will take you 10 packets to get the same amount of data that you could get in one packet with the other protocol. This means that if your response time is 100ms per packet it will take you either 100ms or 1 second to get the same amount of data.
The protocols that are supported by the device will also make a difference in how you plan your system. If the device supports Modbus and you have other Modbus devices already then you can use this protocol. If it supports Dh-485, DH+, DF1 and EPIC then you have all these to choose from.
It is also important to find out if the protocol will allow multiple requests. What this means is that the protocol will allow you to ask for data from multiple devices at the same time. Most serial protocols do not. This means that if you have a multidrop serial network Citect will ask for data from 1 plc, it will then wait until that request is serviced and then send a request to the next PLC, wait for that data then request some data from the next plc. If the protocol supports multiple requests then Citect will be able to issue requests to each of the plc’s at the same time and then get the responses as they come in. If this is supported then you can be gathering data from multiple sources at the same time.
This doesn’t really help you unless you have more than 1 plc to communicate with. There are some PLCs that can handle multiple requests for data but not many.
Number of Communication Ports for each method
If you have only 1 port for comms on the PLC then you will most likely not be able to use Citect and any other software package, such as your programming software, at the same time.
If the PLC has two or more communications ports then it is much easier to setup a redundant Citect system as each IO Server will have their own communications port. There will be no conflict over which PC is the current one doing the talking.
This is really only going to have an impact on your response times if you do need to use both ports at the same time. If you do need to do this then you should check to see if the PLC will slow down its responses in relation to how many of the communication ports are being used simultaneously. Many PLCs will virtually double their response times if they need to service requests for data from two ports simultaneously.
If this is a necessary point for your system then usually the PLCs that have a dedicated comms interface card will not suffer, but they will still have the problem where they are limited to the bandwidth of the bus speed of the rack.
Method the PLC uses for servicing communication requests
This is going to influence directly the response times of your PLC. Some PLCs will wait until the end of a scan and then service 1 request. Some will wait until the end of a scan and service multiple requests. Some will service requests (including writes) at any time through the scan. If at all possible get one that can service multiple requests for data in one scan. This will mean that the protocol can support multiple data requests, and the whole system can respond faster. Some PLCs allow you to allocate a certain percentage of CPU time for comms processing – tuning this may yield better response.
The ideal PLC for very High Performance will be one with a very fast scan (powerful CPU), able to service multiple requests for data, has communication ports that directly access the CPU or memory of the PLC and is easy to setup. Bear in mind the relative benefits to be gained here. It may not be worth the hassle setting up a machine that has all these capabilities. Some boxes have many parameters that you need to get exactly right for them to work to potential; something that is just as fast or only 1-2% slower yet has little or no configuration involved is obviously the better proposition.
One other point that may have an influence really doesn’t have anything to do with pure performance, but ease of use and flexibility. Try and choose components that adhere to some type of open standard, particularly for communications. This will make everything much easier to troubleshoot later and will hopefully not lock you in to any one manufacturer. This is one of the main reasons that Ethernet comms is so popular. The Interface cards are cheap, the technology is matured and very well proven, the problems with it are well documented and there are many tools available for investigating and managing ethernet based networks.
Ethernet may not give you the best performance, but it will not be far off and is a lot more flexible and cheaper than most proprietary networks.
Design of your PLC code and data structures.
There are really only a couple of steps in the gathering of data. A Client will request the data from an IO Server. If the IO Server still has that data in its cache, and it is fresh enough, it will send the data from its cache in response to the request. If the data is not in the cache, or is stale, then it will request the data from the iodevice. Once it gets the data back from the iodevice it will store it in its cache and at the same time pass it back to the client that requested the data.
Very Simple really.
This knowledge becomes important when you are trying to work out how to structure your data in the iodevice. Taking into account that all server tasks are clients to the IOServer then you must look at the number of Trends, Alarms and Reports that will be needing data as well as the data that will be needed for each graphics page.
All alarms will be scanned on a regular basis, so it makes sense to try and block all the data together for alarms. Trends are similar except that you should try and block all trend data that has the same sample period together. Then, if you have setup some 1, 5 and 30 second trends, each time the Trend Server request this data from the IOServer it can get this data as efficiently as possible from the plc.
Blocking these two sets of data together will give you the best performance boost for the smallest effort. If you want your system to be as good as it can get then you will also need to make sure that every Graphics page is requesting data that is blocked together. This can be very difficult and time consuming but the systems I have seen that do this, typically have response times of less than 200ms.
This covers the most important aspects of pre planning for a totally new Citect system. Now we get into what you can do to make your existing system performance better.
Optimising an Existing Citect System
This information is much more indepth regarding the workings of Citect. Here we will go through the information that you can use from the Diagnostic tool within Citect known as The Kernel. There is quite a lot of information available in the Kernel, and most of it is of no value to the end user, however if you are really interested you can get in here and see everything that is happening in your Citect system.
This now assumes that you have your system going and would like to make it perform better, or that your system is performing below what you think it should and you would like to investigate the matter to see if you can do anything about it.
Before we get into tuning your Citect system there is a lot of explaining needs to be done so you know what it is you are looking at in the Kernel.
The Citect Kernel
As Citect was originally designed as a true Multi-Threaded, Multi-Tasking system it was found that as the system got more and more complicated the programmers needed a way to observe what their changes were actually doing within the program, at run time, without having any performance impact on the running version of Citect.
Since Citect was handling all of the tasks it needed in order to operate, it was decided to build a window into the running instance of Citect. This was how the Kernel was developed. It was called a Kernel because of the similarities between Citect and a real operating system.
Getting into the Kernel
To use the Kernel you must first have access to it. To do this there are a few different ways.
The two main ways are by editing your CITECT.INI file to allow access to the Kernel. One can be done through the Computer Setup Wizard and one must be done manually or through the help. Essentially what you need to do is to edit your INI file to have
[DEBUG]
Menu=1
This will place an entry for the Kernel on the Control Menu that you get when single clicking on the left of the title bar or by pressing Alt-Space. Also you may add
[Debug]
Kernel=1
This will show the Kernel as you are compiling (not very useful) and also when you are starting up Citect. (Extremely Useful) As most problems with Citect are to do with something not communicating or not connecting properly, the only way to see exactly what happens and when is to be viewing the Kernel as Citect starts up. This can also be a little difficult to view as the Main window is the one you need to see and it is not Maximised on startup. I have found the best way to do this is to double click on the Main Window title bar then Double click on the Kernel Title Bar. This will Maximise the Main Window first inside the Kernel then the Kernel window. This can take some practice but can be very useful. Quite often you will immediately see what the problem is just by being able to see the startup sequence that Citect is going through. Citect will immediately popup on the screen as it has finished initiating. To get back to the Kernel in its maximised state use the TaskBar or Ctrl-Esc but don not use the Kernel item on your menu as this will restore the Kernel window and you cannot see all the information you had available. Then you have to start Citect again. Very much a waste of time.
Once you are in the Kernel you should see a Line by Line description of what Citect did when it started up.
A typical screen will look like this.
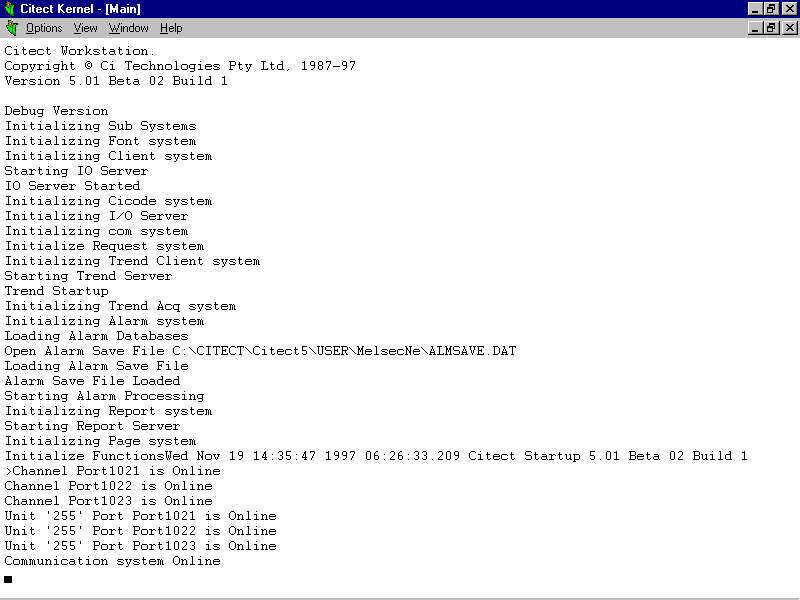
OK What this tells you is this.
First you see what Version of Citect you are running. In this case I was running V5.01 Beta 2 Build 1.
Debug Version - I am running a Debug Version. This is not a normal production version of Citect and anything may happen. If it does please report the event and exactly what you did to create it. This is how bugs are fixed before they get into Production Versions of Citect. If you don’t report a bug or a crash then we may never get another chance to track it down and kill it. Please report Bugs.
Initializing Sub Systems – Citect Kernel started.
Initializing Font System – This is now creating all fonts that have been defined within Citect. These are fonts for displaying items such as Alarms, and any pre V5.0 dynamic text.
Initializing Client System – I think this is sorting out what servers the Client needs to talk to, as set in the INI file by
[Client]
Primary = xxxx
Standby = yyyy
Starting IO Server – If this PC is an IO Server you should see this. If its not then you won’t see this. However if its supposed to be an IO Server and you don’t see this then you have most likely not got the PC setup properly. Check the name of the IOServer in the project with what you have got in your INI file.
[IOServer]
Server=1
Name=IOServerName
This name in the INI file MUST match the name in your project if this PC is to be your IOServer. This is telling Citect that it is an IOServer and which one. Remember you can have up to 255 IOServers in a project so Citect needs to know which one this is supposed to be.
IO Server Started – The IO Server Task started OK. Very unlikely that it won’t start OK. Maybe a severe lack of memory will do this.
Initializing Cicode System – All your Cicode has been loaded into memory and is getting ready to be run.
Initializing I/O Server – Starting to check what is needed to make the IOServer work and initializing any cards that need to be started.
Initializing com System – Making sure that all ports and hardware are working
Initializing Request System – The system that handles requests from the Client part of Citect to the Server parts of Citect.
Initializing Trend Client System – The Trend Client is slightly different than the normal Client so it has its own method of doing things.
Starting Trend Server – If you are a Trend Server you will see this. If you aren’t you won’t.
Trend Startup – This is when Citect either checks for all the trend files or it makes new files. It is also now that it will see when the last time was that the Trend Server logged data in case it needs to request missed data from a redundant Trend Server.
Initializing Trend Acq System – Every trend you define has its own sample rate. This is setting up the system so it can poll the data needed at the correct rate for each trend pen.
Initializing Alarm System – Starting the Alarm Server. If you are not an Alarm Server you won’t see this
Loading Alarm Databases – This is loading all alarm data into memory
Open Alarm Save File
Loading Alarm Save File
Alarm Save File Loaded – Citect will get the Alarm Save file that was created in the directory you specified and examine it in order to see the status of existing alarms. If you have a redundant Alarm Server then this Alarm Server will interrogate the other Alarm Server instead of using the Alarm Save file as the information that the other Alarm Server has should be newer than any file.
Starting Alarm Processing – This happens now that the Alarm Server knows the status of all alarms. We don’t want to make the operators have to Ack all the existing alarms all over again.
Initializing Report System
Starting Report Server – Starting the Report Server. If you are not a Report Server you won’t see this.
Initializing Page System – This is now going to display your Startup Page. Its at this time that Citect will cover up the Kernel. To get back to the Kernel use the TaskBar or switch to the kernel with Alt-Tab or Alt-Esc.
Initializing Functions – Starting any Cicode function that you have told Citect to use on Startup.
The next part shows you once again the version of Citect and the time it was started.
Channel Port1021 is Online
Channel Port1022 is Online
Channel Port1023 is Online
These are messages telling you that any ports you have defined in the IO Server (assuming you are an IOServer) have come Online.
If you get any other messages they will tell you that either a Port could or could not be opened.
If you get a message saying that a port is not online or could not be opened then check your information in the project under Communications. This could be wrong.
Unit ‘255’ Port Port1021 is Online
Unit ‘255’ Port Port1022 is Online
Unit ‘255’ Port Port1023 is Online
These messages indicate that the PLC that has an Address of 255 and is attached to Port1021 is Online and Citect can communicate with it. The same is true for the other 2 PLC’s with address 255 but they are attached to different ports.
Communication System Online – All Is Good.
Areas you should watch for here now are that all your PLC’s come online. First the ports must be initialized OK and be online, then the PLC’s should all come online. Some PLC’s may take 2 attempts from Citect to come online or may not be connected yet or whatever. In that case you will see messages that are specific to every PLC type. All these messages are basically similar though as they will tell you something like PLC not responding, or, Unit Offline, or something else like that. If your PLC is difficult to connect to then wait 30 seconds (the standard period that Citect waits until it will try to connect again) and see what happens this time. If still nothing good happens then it is time to check EVERYTHING.
Inside the Kernel
Main Commands for Troubleshooting and Data Gathering.
Page Unit
Page Driver
Page General
Debug
Probe
Page Table Stats
Stats
Cache
Netbios
Page Netstat
Page Table Tran
Commands are issued at a command line interface (similar to the DOS prompt), usually from the Main Kernel window. Some commands display their results in the Main Kernel window, while others open a child window for information display (or for further commands)
You can use several keyboard keys to scan and reuse commands from the command history, to speed up the issuing of Kernel commands. (The command history is a list of commands that you have previously issued). These keyboard keys are listed below:
Key Description
Up arrow Scans back through the command history. (Commands are displayed in the command line.)
Down arrow Scans forward through the command history. (Commands are displayed in the command line.)
F3 Puts the last command you issued in the command line.
Left arrow Moves the cursor back one character at a time (in the command line).
Right arrow Moves the cursor forward one character at a time (in the command line).
Delete Deletes the character to the right of the cursor (in the command line).
Backspace Deletes the character to the left of the cursor (in the command line).
Insert Switches from over-strike mode to insert character mode (in the command line).
Gathering Information
The first 3 sections in here are all just for gathering information.
These pages in the Kernel are
Page Unit
Page Driver
Page General.
These pages show similar information but at an increasingly individual level.
Page General shows you statistics for your Total Citect PC. This information includes statistics and errors from ALL Protocols running on your PC. As any single I/O Server is capable of supporting multiple Protocols (up to 64) simultaneously, you need to be able to get a quick “At a Glance” overview of the system as a whole. This is what you see in Page General.
Page Driver shows statistics for individual Protocols one for EACH port that that Protocol is running on. For example, if you have a system with a 4 port serial card and are using the Modbus Protocol on two of these ports, you will see two pages with Driver info for Modbus, but on separate ports. This then gives statistics for everything attached to the individual ports.
Page Unit shows you statistics on individual I/O Devices.
Using this information you can easily pinpoint bottlenecks in your system. Even today with faster and faster I/O Devices the main bottleneck in any Citect system is the overhead introduced in communication with the outside world. From Page General you can get a good idea of the overall response times in your system. If it seems to have a large Average Response time, you can then check Page Driver to see which Protocol on which Port is slow. Then you can look at Page Unit for I/O Devices that are attached to that port in order to find the offending I/O Device. Once you have identified the bottleneck you may be able to do something to speed up the communications.
Page Unit
This shows info on individual IODevices (Memory, Disk and External).
Displays information about each I/O Device in the Citect system. This information is displayed if the Citect computer is configured as an I/O Server or simply as a client. If the computer is a client, then all the I/O Devices for all the I/O Servers are displayed. If the computer is an I/O Server, then only the I/O Devices for that I/O Server are displayed. You can display I/O Devices from other I/O Servers by using the Verbose mode (press V to enable Verbose mode). If the computer is a client, then not all of the I/O Device Information is updated (because only the I/O Server has this information).

This detailed description of all the fields shown in this dialog box is taken directly from the help. (Read the Help. It is a Good Thing.)
If the Citect computer is a client, the status and error codes are only local to the computer and do not reflect the true status of the I/O Device on the I/O Server. Note that all configured I/O Devices are displayed in this window, not just the I/O Devices for the particular I/O Server. (Any remote I/O Devices do not reflect the true status of the I/O Device).
Use the Page Up and Page Down keys to scan the I/O Device list.
Unit
The name of the I/O Device defined in the database (with the I/O Devices form).
IO Server
The name of the I/O Server that is servicing this I/O Device.
Comment
A description of the I/O Device defined in the database (with the I/O Devices form).
Unit No
The I/O Device number defined in the database (with the I/O Devices form).
PLC Number
The physical I/O Device address defined in the database (with the I/O Devices form).
Port Name
The communication port to which the I/O Device is connected.
Protocol
The protocol used for communication with the I/O Device.
Server Status and Client Status
The status of the I/O Device. The Server Status field is only valid if the computer is an I/O Server and it is servicing this I/O Device. The Client Status field is valid for Clients only. This will give an indication of the state of the I/O Device that is attached to the I/O Server. The I/O Device status can be one of the following:
RUNNING Indicates that the communication link with the I/O Device is good.
STANDBY Indicates that the communication link with the I/O Device is good, but communication with that I/O Device is currently being performed by another port. This port is in standby mode.
STARTING Indicates that the server is currently establishing a communication link (with the I/O Device).
STOPPING Indicates that the server is currently relinquishing control of the communication link (with the I/O Device).
OFFLINE Indicates that the server cannot establish a communication channel with the I/O Device. If a standby port or server is available, Citect tries to communicate to the I/O Device using that port.
Primary
Indicates the mode the I/O Device is in, Yes = Primary, No = Standby.
Generic Error
The last generic error code returned by the driver. Because all protocol drivers have their own special errors, they cannot be recognized by the I/O Server. The drivers convert their special errors into generic errors that can be identified by the server.
Error Handle
The error handle that is assigned by the I/O Server to each error. This handle is not used by Citect (at this time).
Driver Error
The driver-specific error code. Each driver has its own special error codes. Refer to the driver specific errors (for the particular protocol) for an explanation of each of the error codes.
Error Message
The error message associated with the generic error code.
Error Count
The total number of errors from the I/O Device.
Restarts
The number of times the server has tried to establish a connection with the I/O Device. This number is normally 1, because the server establishes a connection at startup. If this field displays a number greater than 1, there is a problem with the communication channel.
Response Times
The time taken by the driver to process read and write requests (i.e. the time taken to process a single read or write operation to the I/O Device). This time depends only on the physical response time of the I/O Device, because no queue waiting time is included. The average, minimum, and maximum times are displayed.
This information will tell you if your I/O Device is responding quickly or is responding slowly. As Citect needs to gather all data for a Graphics Page before it can update the page, having a slow I/O Device will slow down the whole update of your screen. If you see that all of your I/O Devices are responding with an average time of 500ms and one I/O Device is responding in 2000ms then it will be reducing the performance of the whole system. Page updates with data on them from this slow I/O Device will take 2000ms minimum.
Cached
This field indicates if the I/O Device data is cached.
Cache Timeout
If the I/O Device is cached, this field displays the cache timeout value. Data is held in the cache for this timeout period before being discarded and re-read from the I/O Device. Only read data is cached.
Blocking Constant
The current blocking constant value for this I/O Device, as specified in the protocol.
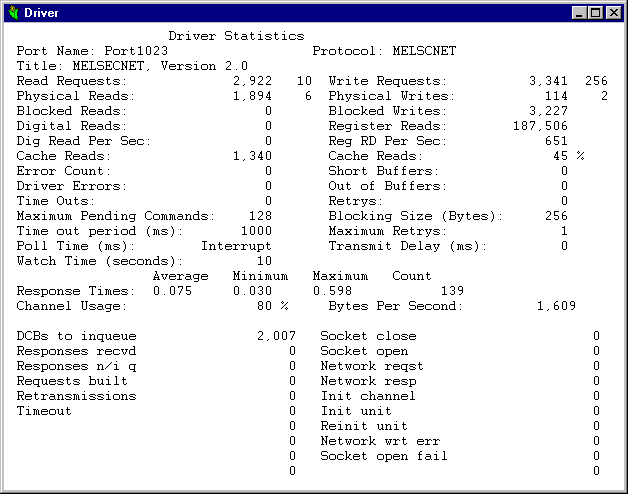
Page Driver
Displays information about each driver in the Citect system. This window is only displayed if the Citect computer is configured as an I/O Server with physical I/O Devices attached.
Use Page Up and Page Down keys to scan the driver list.
Descriptions ripped off from the Help again.
Port Name
The name of the physical port the driver is using for communication.
Protocol
The name of the protocol.
Title
The protocol title and version string. All protocol drivers for Citect Versions 3.xx, 4.xx and 5.xx are Version 2.0 type drivers.
Read Statistics
Read Requests
The first number is the total number of read requests sent to the driver from all client Citect computers, including the local Citect client.
The second number is the read requests per second (that the I/O Server is performing).
Physical Reads
The first number is the total number of physical reads made to the I/O Devices. Because the I/O Server can optimise the number of read requests made to the I/O Devices, this number is usually smaller than the number of read requests.
The second number is the number of physical reads per second (that the I/O Server is performing).
Blocked Reads
The total number of times a request was made for the same I/O Device address while the driver was already reading or about to read that address. The driver blocks the two requests together as an optimisation.
Digital Reads
The total number of digital points that the I/O Server has read from all I/O Devices.
Digital Reads per Sec
The number of digital reads per second that the I/O Server is processing. This provides a general indication of performance. It is dependent on the protocol.
Register Reads
The total number of register points that the I/O Server has read from all I/O Devices.
Register Reads per Sec
The number of register reads per second that the I/O Server is processing. This provides a general indication of performance. It is dependent on the protocol.
Cache Reads
The number of read requests serviced from the read cache.
Cache Reads(%)
The percentage of reads serviced from the cache. If the cache read % is large (e.g. greater than 40%), the I/O Device cache timeout could be set too high. Try reducing the I/O Device cache time to bring the % cache below 40%. The % of read cache depends on the configuration of your Citect system and the number of clients connected. If you have many clients looking at the same I/O Device data, the cache % may be very high, however this does not cause a problem. For example, if you have 10 Citect clients viewing the same page, a cache read of 90% would be acceptable.
Write Statistics
Write Requests
The first number is the total number of write requests sent to the driver from all client Citect computers, including the local Citect client.
The second number is the write requests per second (that the I/O Server is performing).
Physical Writes
The first number is the total number of physical writes made to the I/O Devices. Because the I/O Server can optimise the number of write requests made to the I/O Devices, this number is usually smaller than the number of write requests.
The second number is the number of physical writes per second (that the I/O Server is performing).
Blocked Writes
The total number of times a request was made for the same I/O Device address while the driver was already writing that address. The driver blocks the two requests together as an optimisation.
Other Statistics
Error Count
The total number of errors encountered by the driver.
Short buffers
The number of times the server needed a buffer for the driver but none were available. This can reduce communication performance and result in loss of requests. Increase available memory if this field increments too quickly (ie more than 10 per minute).
Driver Errors
The number of low level driver errors encountered before retries were performed. This field may continue to increment even if no errors are reported because the driver retries and it may complete the command on the second attempt. If this field increments quickly (i.e. 10 or more per minute) without other errors being reported, you may have a low level error that affects performance.
Out of Buffers
The number of times the driver requires a buffer but none were available. The driver must discard the data. If this field increments too quickly, increase the number of pending commands the driver can process. This field only increments with client drivers. I/O Device drivers do not require pending buffers.
Time Outs
The number of timeouts encountered by the driver during operations. This field may continue to increment with no visual errors as the driver retries the operation. If this field increments excessively, there may be a communication problem.
Retrys
The number of retries executed by the driver. If this field is incrementing, there may be a communication problem.
Protocol Specific Parameters
Maximum Pending Commands
This is the number of requests that are kept in a buffer waiting to be serviced by the protocol. There is a pre defined default value for this for every protocol. If a protocol is capable of handling multiple requests or commands at a time then this number may be high. If the protocol is capable of only handling 1 command at a time then this will probably be 1 or 2.
Blocking Size (Bytes)
This is the size or range that the IO Driver will use when blocking read or write requests together at runtime. This Default value for this is typically set after quite a lot of experimentation. The value is calculated as the optimum range of data that the I/O Device can respond to, to get the fastest response times from your I/O Device.
As an example : If the Blocking Size is 100 and you have a graphics page that has Address1 and Address 99 on it. Citect will read both of these addresses in one request. If you have Address 1 and Address 101 on the page Citect will issue 2 read requests. The block size may not be the maximum packet size for the protocol, as during testing, it was found that a particular type of I/O Device will respond to smaller requests of data faster than larger requests.
There is a drawback to this method. Many I/O Devices must have their Memory tables created by the user. If the User does not define all memory addresses in a range then , at some stage, Citect will try and read a block of memory from the I/O Device that does not exist. This will then show as a hardware alarm. This is because Citect will ask for the whole range of addresses between the starting address and the ending address, so if in our previous example the I/O Device did not have address 76, it would report back to Citect that it could not read address 76. The IO Driver does not know that it doesn’t need this address and will retry the command, and in some cases will eventually put the device offline.
Make sure that you always have defined the memory addresses that Citect will need to read.
Timeout Period (ms)
This is the period of time that the IO Driver will wait before re-requesting data, if no answer comes from the I/O Device.
Maximum Retrys
The number of times the IO Driver will attempt to get data from the I/O Device.
Combining this with Timeout gives you the total period before Citect will put an I/O Device offline.
If the Timeout=2000 and Retry=2 then Citect will wait 2 seconds for a response, then retry, wait 2 seconds, retry, wait 2 seconds, Offline. Total time between losing communications and deciding it is offline is now 6 seconds. You can modify these parameters but if you set them too low you will generate unneeded retries and possibly also get I/O Device Offline messages when you shouldn’t.
Poll Time (ms)
This is the time in ms that Citect will check the port for data or write data to the port. If this is 0 then the protocol is operating in Interrupt mode.
Transmit Delay (ms)
This is the time that Citect will hold a packet of data between receiving a response from the last request and sending the new request. This is usually 0 but some protocols can become saturated and start to behave in strange ways if this is 0. In these cases the default value has been calculated while the protocol was being tested and modifying this value to something smaller will cause problems, however making it bigger will only have a very slight impact on overall response times in your system, but may make communications much more stable.
Watchtime (seconds)
This is the period of time that Citect will wait after deciding an I/O device is offline before trying to re-establish communications. This is typically 30 seconds. It can be made smaller but must never be made smaller than the period that Timeout and Retry will be. Otherwise you will never be able to re-establish communications with an I/O Device.
Response Times
The time taken by the driver to process read and write requests (i.e. the time taken to process a single read or write operation to the I/O Device). This time depends only on the physical response time of the I/O Device, because no queue waiting time is included. This field reflects any tuning of the communication channel (e.g. doubling the baud rate should half the response time).
The average, minimum and maximum times are displayed.
Channel Usage
This field displays the percentage of the total capacity of the hardware channel that is currently being used. The I/O server always tries to keep the utilisation as high as possible, however if the client Citect computers are requesting data slower than the channel can supply, the total will be below 100%. It is possible for the channel usage to rise above 100% as some I/O Device drivers can process more than one command at the same time (having two or more commands using the channel at the same time).
Bytes Per Second
The number of bytes transferred (each second) by the driver. This number provides a simple performance indication that is useful when tuning the driver.
Special Variables
By enabling verbose mode (press V) or by pressing the down arrow, twenty special variables are displayed. The meaning of these variables is driver-specific.
Page General
Displays general statistics information on the overall performance of Citect.
General Information
Server Name
The server name of this computer or, if it is a client, the name of the primary server this client talks to.
Node Name
The Node name of this computer as set in your CITECT.INI file by the Computer Setup Wizard. This is only valid if you have the Networking in Citect turned on.
Time
The (current) time of day.
CPU Index
An indication of the performance of the Computer. This number provides a rough indication of the performance of the computer. On a Compaq 486/25M it will be 25.
Running
The total time Citect has been running.
Memory Total
The total amount of free memory (including virtual memory).
Memory Physical
The total amount of free physical memory. The physical RAM that is free on the computer (not including virtual memory).
Memory Resources
The % of free Windows system resources.
Scheduler Cycles
This number is completely different if you are running 32 bit or 16 bit Citect.
Under 32 bit versions the schedule cycles is much lower than 16 bit versions. This is because with 32 bit versions Citect is using Windows to perform the process scheduling. Under 16 bit the Citect kernel controls the scheduling and so the scheduler cycles is much higher. With the 16 bit version the scheduler cycles will be higher if Citect is not very busy. The busier Citect is the lower the value. It will also depend on how fast your computer is. The faster the computer the higher the scheduler cycles.
Typical values of Scheduler Cycles in 16 bit would be between 10,000 to 50,000 (may be as low as several hundred on heavily loaded systems). With the 32 bit version the scheduler cycles will depend on how busy Citect is. The busier Citect is the higher the value. Typical values of the Scheduler Cycles in Citect in 32 bit would be between 100 and 1000.
CPU Usage
The percentage of the total available computer processing power that Citect is using. This will change depending on the Version of Windows you are running. With Win 3.11 this is the % of CPU that Citect is using, with Win NT it is the % of CPU utilisation on the whole PC (this is because Citect is now being run under a real multitasking OS and is using NT’s scheduler), under Win 95 it may tell you exactly what Citect is using, but if you run some 16 bit applications then the % can change without any change in Citect. Win 95 is a very confused OS.
As the percentage increases to a high level, the performance of Citect may level off or become sluggish. If the CPU usage is consistently very high (greater than 70%), there could be a problem with your system or you may be overloading the CPU. For best performance, your system should run between 0% and 40%. However under NT it is sometime perfectly OK to run at 100% CPU utilisation. This is because Citect will only take the CPU when NT lets it.
Tasks Per Sec
The number of tasks per second that the Citect scheduler is executing, to show how busy Citect is. This number should be between 30 and 200 tasks per second. If the computer is an I/O Server, the task number is higher (because each protocol uses many tasks).
Lost Errors
Citect keeps track of internal errors in its local error buffers. Lost Errors is incremented when an error occurs and there is no buffer in which to put the error message. This number should normally be 0 (zero). If this field is incrementing, you may have a problem with your system.
I/O Server Statistics
The following statistics are only incremented if the computer is configured as an I/O Server.
Read Requests
The first number is the total number of read requests sent to the I/O Server from all client Citect computers, including the local Citect client. This number continues to increment from 0 (to billions) depending on how fast clients are requesting data and how long the server has been running. The second number is more useful - it records the read requests per second. This value also depends on how fast the clients are requesting data from the I/O Server, and should be between 5 and 400 requests per second.
Physical Reads
The first number is the total number of physical reads made to the I/O Devices. Because the I/O Server can optimise the number of read requests made to the I/O Devices, this number is usually smaller than the number of read requests. This number is similar to the read requests and increments forever.
The second number is the number of physical reads per second (that the I/O Server is performing). The rate depends on the clients and how fast the server can communicate to all the I/O Devices (typically 5 to 200).
Blocked Reads
The total number of times a request was made for the same I/O Device address while the I/O Server was already reading that address. The server blocks the two requests together as an optimisation.
Digital Reads
The total number of digital points that the I/O Server has read from all I/O Devices.
Digital Reads per Sec
The number of digital reads per second that the I/O Server is processing. This provides a general indication of performance. It is dependent on the protocol.
Register Reads
The total number of register points that the I/O Server has read from all I/O Devices.
Register Reads per Sec
The number of register reads per second that the I/O Server is processing. This provides a general indication of performance. It is dependent on the protocol.
Cache Reads
The number of read requests serviced from the read cache.
Cache Reads(%)
The percentage of reads serviced from the cache. If the cache read % is large, (e.g. greater than 40%), the I/O Device cache timeout could be set too high. Try reducing the I/O Device cache time to bring the % cache below 40%.
The % of read cache depends on the configuration of your Citect system and the number of clients connected. If you have many clients looking at the same I/O Device data, the cache % may be very high, however this does not cause a problem. For example, if you have 10 Citect clients viewing the same page, a cache read of 90% would be acceptable.
Write Requests
The first number is the total number of write requests sent to the I/O Server from all client Citect computers, including the local Citect client. The second number is the write requests per second (that the I/O Server is performing).
The number of requests depends on the rate at which clients are sending write requests to the I/O Server (typically 0 to 20). If the number of requests always exceeds 10, then this may be causing performance problems (usually caused by Cicode performing too many writes to the I/O Devices).
Physical Writes
The first number is the total number of physical writes made to the I/O Devices. Because the I/O Server can optimise the number of write requests made to the I/O Devices, this number is usually smaller than the number of write requests. The second number is the number of physical writes per second (that the I/O Server is performing).
The number of writes depends on the rate at which clients are sending write requests to the I/O Server (typically 0 to 20). If the number of requests always exceeds 10, then this may be causing performance problems (usually caused by Cicode performing too many writes to the I/O Devices).
Blocked Writes
The total number of times a request was made for the same I/O Device address while the I/O Server was already writing that address. The server blocks the two requests together as an optimisation.
Cache Flush
The number of times a cache buffer was flushed because a write request was directed to the same location. When you write to the I/O Device and that address is in the read cache, Citect flushes the data from the cache. The next time the data is read, it is reloaded from the I/O Device to reflect the new value.
Cache Buffers
The number of active cache buffers allocated. Each block of data that is read from the I/O Device requires a cache buffer when stored in the cache. The number of cache buffers active at once depends on the dynamic operation of the Citect computers and their database configurations (typically 0 to 100).
Cache Short
The number of times the cache needed to allocate additional buffers but no buffers were available. When this happens the server cannot cache the data. This does not generate errors but it does lower performance. If this field increments too quickly, increase the available memory.
Response Times
The time taken by the I/O Server to process read and write requests (i.e. the time from when a request arrives at the server to when it is sent back to the client). This time depends on the physical response time of the I/O Device and how long the request had to wait in a queue for other requests to be completed. This time increases as the server’s loading increases, and is the best indication of the total system response.
The average, minimum, and maximum times are displayed. Typical values depend on the I/O Device protocol, however Citect should have an average response of 500 to 2000 ms. Slower protocols or a heavily loaded system may make the response time higher, but you should be able to get response times of less than two seconds—even for very large systems.
Probe
Opens a child window, displays read and write requests to all I/O Devices, and displays the responses from the I/O Devices. The child window displays exactly what Citect is requesting from the I/O Devices and the speed of the response.
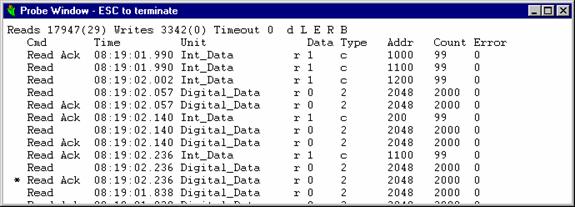
Or Probe Int_Data (Probe can also be done on a specific IODevice)
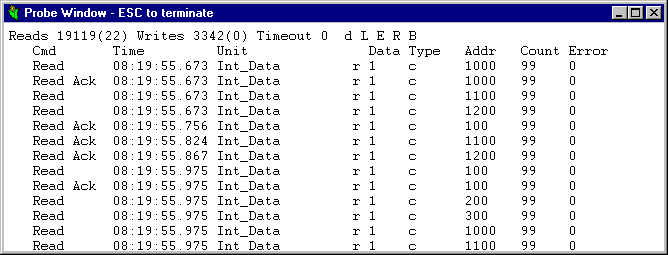
The child window shows each request that Citect is making to the I/O Server. A request can be either for I/O Device data, or to write data to the I/O Device. The response from the I/O Server is also shown. The displayed requests are from the local client to the I/O Server only. This means that all data requests from this PC to the IOServer will show up in here. If the Client is a Trend or Alarm server then you will see all data requests for these servers as well as any data needed to satisfy a graphics page. If this Citect computer is an I/O Server, the Probe window only displays the local Client’s requests, and not those from remote clients.
Keyboard Commands in the Probe Window
Five options are supported in this window.You can toggle these options (On and Off) by typing:
D, L, E, R and B
NOTE: If you re-size this window, you must the press a keyboard key to re-size the data trace (to the full size of the window, try the Space Bar).
D Display. Enables/disables the display of the trace in the window. The data scrolls as the requests are displayed. You can pause the trace to view the data. The asterisk (*) shows the location of the current request.
L Logging. Enables/disables the logging of this information to the Citect SYSLOG.DAT file. Note that logging to the SYSLOG.DAT file slows the system, because Citect may be writing large amounts of data to disk.
E Error. Enables/disables error mode, where only commands with an error are displayed.
R Response. Enables/disables the display of the matching request. The Time field will show the response time (the time to complete the request).
B Block. Enables/disables the blocking of read requests and the read response data together. This allows you to see the request and response next to each other. Normally you will see the requests and the responses in chronological order.
Request and Response Information
Reads
The first number is the total number of reads from this client.
The second number (enclosed in braces) is the number of reads per second.
Writes
The first number is the total number of writes from this client.
The second number (enclosed in braces) is the number of writes per second.
Timeout
The total number of timeout errors that have occurred. If this variable is constantly increasing, then timeouts are occurring between Citect and the I/O Server. You can set the timeout with the [LAN]TimeOut parameter.
Cmd
The command type. The command type can be one of the following:
Read Read request from the Client to the I/O Server
Write Write request from the Client to the I/O Server
Read Ack Read data from the I/O Server to the Client
Write Ack Write acknowledge from the I/O Server to the Client.
Time
The time when the command was detected. The time is in the format HH:MM:SS:mmm, where the time is measured from when Windows was started. By subtracting the request time from the response time, you can calculate the time to service the command.
I/O Device
The I/O Device that the command is directed to. This is the I/O Device name as defined in the database (using the I/O Devices form). The status of the I/O Device can be one of the following:
d Disabled. The I/O Device has been disabled locally and the request is not sent to the I/O Server.
s Shutdown. The I/O Device is off line or the I/O Server cannot be found. The request is not sent to the I/O Server.
r Running. The request is sent to the I/O Server to service the request.
Data
The raw data type:
0 Digital
1 Integer
2 Real
3 BCD
4 Long
5 Long BCD
6 Long Real
7 String
8 Byte
9 Void
Type
The I/O Device type. This field depends on the protocol.
Addr
The I/O Device address. This field depends on the protocol.
Count
The I/O Device count (the amount of data to read). This field depends on the protocol.
Error
The current error code. This error code is in hexadecimal where 0 is no error.
Debug
This is a difficult window to show and explain. As every protocol is completely different Debug will show you different information depending on what Protocol you are using and what mode of debug you are doing.
This is explained once again very well in the help and copied into here.
Enables the debugging of all raw data that is transferred between Citect and a selected driver. All protocol traffic is displayed in the Kernel window and logged to the SYSLOG.DAT file. The syntax is:
Debug <sPort> <Mode> <[Display]>
Where:
<sPort> A port name configured in the database (using the Ports form)
<[Mode]> The mode:
ALL Trace all low level communication traffic to the Kernel window.
READ Trace the low level communication traffic of all read commands to the Kernel window.
WRITE Trace the low level communication traffic of all write commands to the Kernel window.
ERROR Trace any low level communication traffic that contains a protocol error. This mode only generates traces when an error occurs, so you can leave this option on for long periods of time (to find difficult problems).
TO Display the high-level requests going to the protocol driver.
FROM Display the high-level request coming from the protocol driver.
OFF Stop the debug trace of any type of command.
<[Display]> (Optional)
MONO Send the debug to a Monochrome monitor (if one is attached) as well as the Citect Debug Kernel.
MONOONLY Send the debug trace to the monochrome monitor only (and not to the Citect Debug kernel).
To place a port in debug mode, enter DEBUG followed by the port name and the mode you require. If you do not know the name of the port, enter DEBUG (without any arguments), and Citect displays a list of all available ports.
Only the I/O server communicates with the I/O Devices, so this command is generally used only on the I/O Server.
When you enable a debug trace mode, Citect displays all protocol traffic in the Kernel window and logs it to the SYSLOG.DAT file. This tends to reduce Citect’s performance (as there may be a lot of data), and therefore you should not enable debug trace on an I/O Server that is critical to your current operation. Use this command only during commissioning or on a non-vital section. Excessive use of this command may cause the I/O Device to go off line.
When the debug trace is sent to a Monochrome monitor, it is displayed directly from the interrupt routine of the driver and therefore at a much faster rate. This trace (if MONOONLY is used) causes less CPU overload of Citect while the trace is active, and provides instantaneous output. This method is useful if you are developing your own driver and your driver crashes before the debug trace is displayed in the Kernel.
You can use the Shell command to create an extra command window while the trace is active. This allows you to enter more commands (in the new window).
You can use the Pause command to stop the debug output (to view the data).
The output from Debug goes into the SYSLOG.DAT file in your Windows directory. This file is by default 300k in size. When it reaches 300k Citect renames it SYSLOG.BAK and starts a new SYSLOG.DAT. If you want this file to be bigger you can set the size of it with the parameter
[DEBUG]
SyslogSize=1000
This sets the size of the file to 1000k
As Citect locks this file while it is running you may not be able to view it unless you shutdown Citect. If you want to view while Citect is running you can access the file from the View menu in the Kernel. To navigate around the file use the Page Up and Page Down keys.
Tuning your System for best performance.
Page Table Stats

This one is not explained in the help.
Essentially the only part you need to know about is the Cycle Min, Max and Average time. These times are in Seconds and give you an exact cycle time for some of the tasks that are happening within Citect.
This capture is from a very simple system. It has only Digital Alarms and no Trends. The Digital alarms have been set to try and scan at a rate of 50ms and have had an maximum scan rate of 110ms and average of 62ms. Not much you can do about this apart from set the Alarm Scan Rate. If you have trends and they all have different Sample Periods then you will see a Trend Acq listing in here for each different sample period. The important piece of information in here is the Citect 0 listing.
This shows you the exact cycle times for updating Citects graphics page. The times in here are a total value of the time taken for the Client to request data from the IOServer, the IOServer to get that data, either from the PLC or from Cache, then the IOServer to send the data back to the Client then the Client to redraw or update the screen with the new information. These times then will cover all the data needed by a screen from all the different IODevices involved. The Maximum value will give you a good idea if your system has been experiencing slow periods and the Average shows you on average the overall time taken to update any screen in your system.
This information is important in getting the best out of your system. Now you have this information you can tune your system to operate at its peak efficiency. This is another extract from the Help system. (It really is worth reading occasionally)
Caching Data
On large networked systems with many Display Clients, you can improve communications turn-around time by using memory caching.
When caching is enabled, all data that is read from a I/O Device is stored temporarily in the memory of the I/O Server. If another request is made (from the same or another Display Client) for the same data within the cache time, the Citect I/O Server returns the value in its memory - rather than read the I/O Device a second time. Data caching results in faster overall response when the same data is required by many Display Clients.
A cache time of 300 milliseconds is recommended. You should avoid using long cache times (in excess of 1000 milliseconds), because the data can become 'stale'.
NOTE: You can not use data caching for Memory or Disk I/O Devices, as Memory I/O Devices are not shared on a LAN and not serviced by an IOServer, and caching Disk I/O Devices is a waste of memory as File Caches do the same thing but better.
How It Works
Unnecessary reads can be generated when one client requests the I/O Server to read data from the PLC. The I/O Server reads the data from the PLC and passes it back to the first client. Just after the I/O Server has sent the data back to the first client, the second client requests the same data. The I/O Server must now do another read of the PLC, that could have been serviced by the first read. If the I/O Server received the second client’s request before the PLC data was returned, it would have automatically optimised the read - by sending the same data back to both clients (Page General Blocked Reads shows this count).
The unit cache will fill in the gap of the requests between the two clients. If the cache time is set to 300ms, the second client can make a request to the I/O Server up to 300ms after the I/O Server has sent the data back to the first client, and still get the same data. Note that the two clients don't have to be two different Citects on a network, they may be the alarms and trend clients in the same computer, so this tuning will affect even a single node system.
Tuning
The cache should be tuned large enough so that unnecessary reads are not generated, and small enough that old data is not returned while keeping the communication channel busy. If the cache is too large, the communication channel may become idle for short periods of time and so waste its bandwidth. Also if the cache is too large, a Citect client may start to short cycle on reads request, which will generate unnecessary network or internal traffic load.
Read short cycling occurs when a client requests data from the I/O Server, and the data is returned from the cache, so it is returned very quickly. The client will process the data, e.g. display it on the screen (also very quickly), then ask for the same data again. If the I/O Server again returns the same data from the cache, the client will process the same data again which is redundant and a waste of CPU and the network (to transmit the request and response). When short cycling starts to occur, the CPU and network loading will rise while the PLC communication traffic will start to fall.
Tuning the cache is a trial and error process - as you change it, the read cycle time will also change. The cache time will also depend on what the current PLC traffic is. The current traffic is dynamic as Citect will only read what is required depending on the current page, trend, alarm and reports running. You should always be on the safe side and set the cache a bit lower to stop short cycling under lower loading conditions.
To tune the cache you must balance the cache time between unnecessary reads and short cycling. Use the following method:
NOTE: This information assumes to know how to use the Citect debugging kernel.
1. Turn off all unit caching, use the CACHE command in the kernel so you don't have to re-compile your project.
2. Run one Citect client only on the network, use the Client in the I/O Server for the test.
3. Display a typical page to generate normal PLC loading for your system.
4. In the kernel use the STATS command to reset all the Citect statistics.
5. In the kernel display the page 'PAGE TABLE STATS'. This page shows the cycle and execution time of various Citect tasks, some of which consume PLC data. The tasks called 'Citect n' where n is a number (0 for the first instance of a window, 1 for the next open window, and so on) are the tasks which get data from the PLC and display on the screen. Look at the Avg Cycle time, this is the third column from the left. Assume that the Avg cycle time is 1200 ms. T his will mean that the current page is gathering all PLC data and displaying its data on the screen in 1200ms.
6. The cache time should always be below this average cycle time to prevent short cycling. On average it should be less than half this time, ie 600 ms.
7. Set the cache time to half the cycle time (600ms). You may not see any improvement in performance with a single client, as caching will only improve performance with multi clients. You may see improvements is you are also running trends, alarms or reports which are requesting the same data.
8. You should then add another Citect client which is displaying the same data. Reset the STATS and check the Average cycle time. Each new client should not increase the cycle time, it should drop slightly. Also look at PAGE GENERAL, to see that each new client should service its reads from the cache, ie the % cache reads increases.
9. If the average cycle time drops to less than half the original time then short cycling is occurring and you should decrease the cache time until this stops.
Cicode
This command is particularly useful for debugging Cicode functions and running functions directly from within the running system. Once again directly from the Help.
Opens a child window that you can use to call Cicode functions, on either a local or remote computer. Any in-built or user-written function can be called from this window. The syntax is:
Cicode [name]
Where: name The name of a Citect server (e.g. Alarm, Report, Trend) or a client computer name.
If you enter the Cicode command with no name argument, a local Cicode window is created. All Cicode commands are executed on the local computer.
If you enter a server or computer name as the name argument, you can create a Cicode window to the remote server or computer. All Cicode commands entered in a remote Cicode window are executed on the remote computer. For example, to create a Cicode window where all commands execute on the Alarms Server, use:
Cicode Alarm
If you issue the command from a server, you can create a window to the “MyComputer” computer:
Cicode MyComputer
If the remote computer can be found, its name is displayed in the title of the Cicode window, otherwise a local window is created.
NOTE: You can only specify a computer name if you are issuing the command on a server. This function only supports Client to Server or Server to Client connection as it uses already existing Netbios Sessions and does not create new Sessions.
Each Cicode command is executed with its own Cicode task, so you can start tasks that take a long time to complete. The Cicode prompt returns immediately after the Cicode task has started and the task continues to run in the background. If the function is completed immediately, the return result of the function is displayed. If the function continues to run, the result is not displayed and cannot be returned.
WARNING: Remember that there is no Privilege check on any command issued from this window, so you have full access to the system.
The Cicode prompt 0:> shows the current window number with which any object is associated. To change the current window, use the WinGoto() function (or any other Cicode function that affects the current window).
The Cicode window does not recognise any variable names, so when you call a Cicode function, you can only pass constants (e.g. numbers or strings). When you call a function that expects a string, you should pass a string constant, e.g. Prompt("Hello from the Kernel"). If the string is only a single word, you do not have to use delimiters, e.g. Prompt(Hello). The Cicode window tries to convert whatever you enter (as arguments) into the correct data type. If it cannot convert the arguments, it passes either 0 (zero) or an empty string to the function.
NOTE: Some Cicode functions are implemented as label macros by the compiler. These macros allow backward compatibility when the number of arguments to a function has been changed. Because the Cicode window does not expand macros, you cannot call these functions directly. You must use the macro expansion. If the function you are trying to use cannot be found, try again by adding an underscore (_) to the front of the function name, e.g. _DevClose(1)
.
To close the Cicode window:
1. Type EXIT in the command line
- or -
1. From the Cicode window control menu select Close
- or -
1. Double click the control-menu box.
NOTE: You can also shut down the Citect system from this window by using the Shutdown() function.
Networking
Starting up Citect you will see some differences in the information in the Kernel during Startup. These are two screen captures from a very simple networked system. The first is from the Server and the second is from the client.
Server Startup
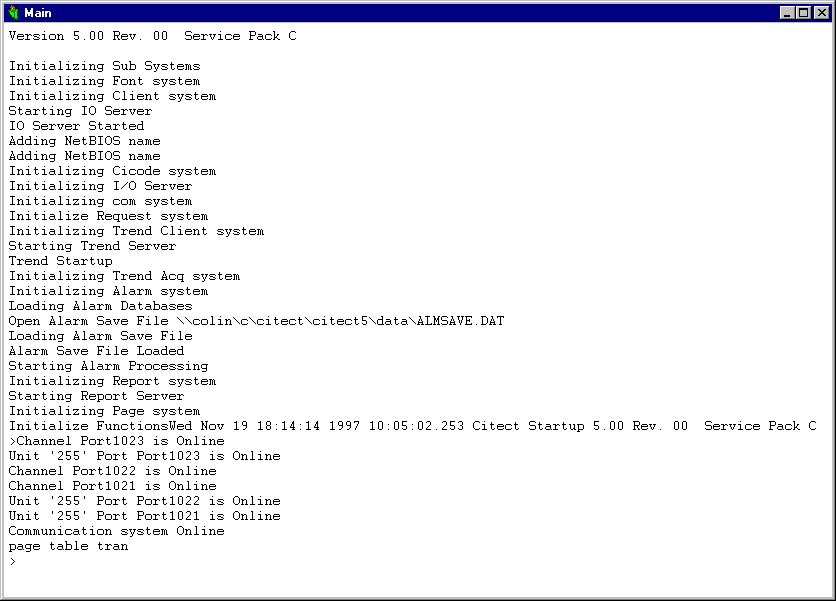
This one from the Server looks nearly identical from a standalone system, except with the addition of two lines.
Adding NetBIOS name – This indicates that Citect has registered NetBIOS names on a Protocol Stack. As this is seen twice during startup Citect has used 2 Netbios capable Protocol Stacks.
Client Startup
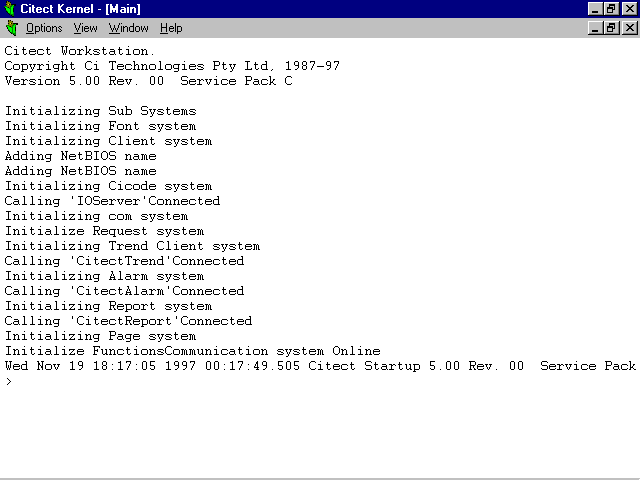
You can see on this startup screen that things are a lot different.
We still have two Netbios capable protocol stacks being used. As can be seen from the two Adding NetBIOS name lines.
From there on though it changes. As this Citect is not running any of the server functions it must connect to a Citect that is running these server tasks.
The lines
Calling ‘IOServer’ Connected – The client went looking for a PC running Citect that had registered the name IOServer on the network on the first NetBIOS capable protocol stack it has. It found that PC and connected to it.
Calling ‘CitectTrend’ Connected – The Client needed a Trend Server called Citect. It looked for something with the NetBIOS name of CitectTrend and found it on the first stack
Calling ‘CitectAlarm’ Connected – The Client needed an Alarm Server called Citect. It looked for something with the NetBIOS name of CitectAlarm and found it on the first stack
Calling ‘CitectReport’ Connected – The Client needed a Report Server called Citect. It looked for something with the NetBIOS name of CitectReport and found it on the first stack.
The names IOServer comes from the name assigned to the IO Server in the project and the name given to the IOServer on the server PC. The CitectTrend , CitectAlarm and CitectReport all come from the name that the Client was told was the name of its Primary Server. The Server had registered these names because we told it that was its Server name in the Computer Setup Wizard.
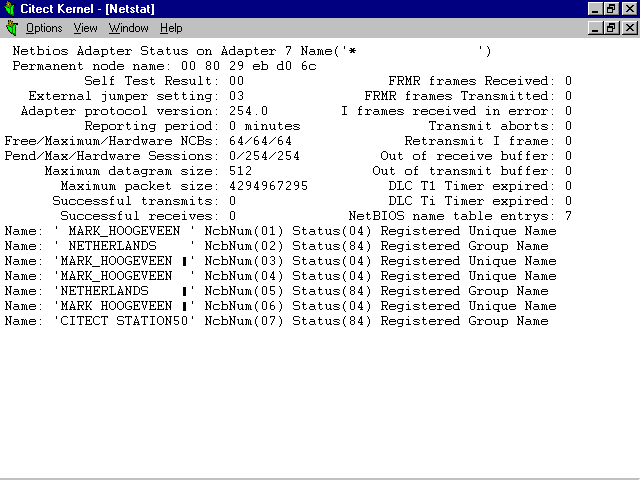
The NetBIOS names registered on your Citect PC can be seen in the kernel by looking at the Page Netstat table.
On the Server it looks like this
Page Netstat
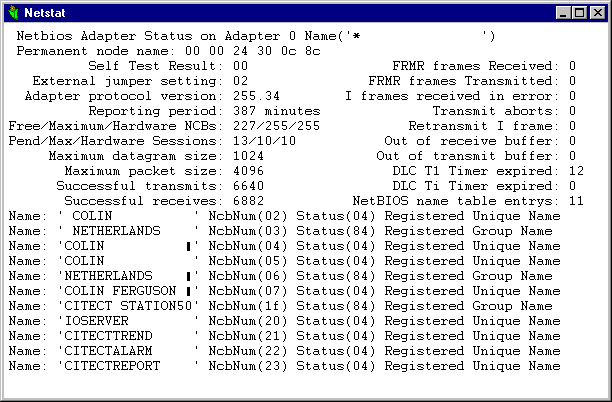
The important parts are the last 4 Names.
IOSERVER
CITECTTREND
CITECTALARM
CITECTREPORT
These are what the Client is looking for.
The other important piece of information on this page is the Adapter number at the top of the page.
In this case it is Adapter 0. This means that we are looking at stats for LANA 0. As we have used two Netbios Stacks then you can see other stacks by using the Page Up and Page Down keys to step through all stacks used.
On the Client PC you will see the following Table
On this table you do not see any of the Server names because this Citect is NOT running any of the Server Tasks. All you see here is the CITECT STATION50 Group Name that is Unique to Citect. Also you should notice that on this PC we are looking at Adapter 7 or stats on LANA 7.
It is very important to know exactly what and how Citect allocates these names. One of the main problems people have with setting a Citect network is deciding on which protocol stack to use.
Citect is capable of using any NetBIOS capable protocol stack. This includes any protocol from Microsoft (as they also depend on NetBIOS for their networking) and many other protocols. It is quite common for a PC to have multiple protocols loaded and Citect will try (by default) to use them all.
If you are using Win95 or Win 3.11 this can cause a problem. This problem is explained in detail in the Knowledge Base in Article Q1861 which is reproduced here. (The Knowledgebase is also very very good reading and a great place to find solutions for your problems)
Setting [lan]LanA=-1 with Windows 95 causes Citect network comms to fail
ID Number Q1861
Date: 03/05/96
Product: Citect for Windows Versions 3.30, 4.10
Summary:
Question: If I set the LanA=-1 and startup Citect it does not communicate correctly across the network. If I change the LanA=0, Citect works perfectly, what is the cause of this problem ?
Solution:
Windows 95 has a limit of 42 pending NCB (NetBIOS Control Blocks). Once this limit is exceeded Windows 95 will start to do weird things with the network. This is a bug in Windows 95. You can verify this is the problem by starting up Citect with LanA=-1 and then display the NetBIOS window from the kernel. If this is your problem you will see thousands of NetBIOS commands being executed, and a lot with a status of 0xFF. The NetBIOS window will be displaying as fast as it can. If you set the V)erbose mode and D)isable the display, you will see in the order of 10,000 NetBIOS commands being executed every second.
You will get this error when setting the LanA=-1 because you have at least 3 NetBIOS LanA loaded and enabled all Citect servers. This can happen if you have all the following protocols loaded, NetBEUI, NetBIOS support for IPX/SPX-compatible Protocol and TCP/IP. It can also happen if you have the same protocol with multi network adaptors, eg multi Ethernet cards or RAS serial connection. If you have the Citect setup as Alarm/Trend/Report and I/O Server then all these servers will communicate on all NetBIOS at the same time. Citect uses up to 5 NCB's per server per LanA so Citect will use (4 (servers) + 1 (client) ) x 5 (NCB) x 3 (LanA) = 75 NCB. This is way over the limit.
On startup Citect will not use it's full limit of NCB's, so you may only get the problem under a running load. On startup Citect will allocate all it's receive NCB (2 per server) and listen NCB (1 per server). Citect will only start using send NCB (2 per server) when it must send data to a client. So on startup Citect may only use (5 x 3 x 3 = 45 NCB), so this is just over the limit and causes the problem. If you remove one server the startup limit will be 36 NCB and so Citect will startup. However under heavy load the 3 servers will start to use their transmit buffers (max 60 NCB), go over the limit and so cause the problem.
So just because you can startup Citect does not mean you will not have the problem. You must calculate the maximum number of NCB Citect can use and make sure it will always be less than 42.
You can work around this problem by:
1). Reduce the maximum number of NCB Citect will use per server by reducing the [LAN]SesSendBuf and [LAN]SesRecBuf parameters.
2). Reduce the number of LanA Citect will communicate over by setting the LanA to just the stack you want. See Q1861 for details.
3). Reduce the number of NetBIOS protocols you have loaded. You can just remove the NetBIOS support for IPX/SPX-compatible Protocol, while keeping the IPX/SPX protocol to allow access to Netware file servers.
3). Use Windows NT as it does not have this problem or any limits on number of NCBs.
Window for Workgroups 3.11 has the same 42 NCB limit when you use any of the Microsoft protected mode protocols.
Author: Martin Roberts
To set your Lana number there is also a very good explanation in the KnowledgeBase.
NetBIOS not Found, with Windows 95
ID Number Q1861
Date: 24/04/96
Product: Citect for Windows Versions 1.00 1.01 1.10 1.11 1.20 2.00 2.01 3.00 3.21 4.00
Summary:
I am setting up Citect version 3.21 to run on a Windows 95 computer. I have NetBEUI and IPX protocols installed, however I keep getting the NetBIOS not Found error message when I startup Citect. I have tried setting the LanA number to 0 and 1, but NetBIOS is still not found.
Solution:
How LanA numbers are allocated has been changed under Windows 95 from WFW 3.11. This change has occurred to support plug an play devices, which can be hot inserted and removed. Because of the hot plug feature the exact LanA number is dynamically allocated and you can not be sure which LanA number each protocol will be using. However if you have a single network card and you don't change the installed network protocols then the LanA numbers should be allocated the same numbers on startup of Windows 95. If you have a hot plug able network card ie PC Card (PCMCIA), when you insert the card it will be allocated a new LanA number.
WFW 3.11 allocated LanA numbers from 0 counting up by 1. So the first (default) protocol was LanA=0, the next was 1 etc. Windows 95 allocates LanA numbers starting at 7 and counting down. However you cannot tell which protocol is on which LanA number If you have IPX/SPX and NetBEUI installed you cannot tell which protocol will be on LanA=6 and LanA=7. However you can force one of the protocols to be the default protocol. This will make that protocol have a LanA=0 and the second protocol will be LanA=7. To make a protocol the default protocol you check the "Set this protocol to be the default protocol" in the protocol properties dialog in the Network setup of the control panel.
To give an example I have NetBEUI, IPX/SPX and TCP/IP installed on my Windows 95 computer. I don't have any protocol set as the default, so there is no NetBIOS with a LanA=0. So the valid LanA numbers I have are 5, 6 and 7, however I cannot tell which protocol is on which LanA number. If I wanted to force Citect to use a particular protocol I would set that protocol to be default and use LanA=0.
A more common example would be to install NetBEUI and IPX/SPX and make NetBEUI the default protocol. So NetBEUI will be on LanA=0 and IPX on LanA=7. Another common example is to have only 1 protocol. In this case the LanA=7 and if you make this the default protocol it will be LanA=0.
A useful tool to find what valid LanA numbers you have is shipped with the 16bit version of Citect. This DOS program is called NETSTAT and is installed in the CITECT\BIN directory. To run this utility you will have to open a DOS box and change into the \CITECT\BIN directory as some version of Windows have another utility called the same name in the windows directory. You can verify you have found the correct version of NETSTAT by typing on the DOS prompt NETSTAT * 8 and you should see the following:
C:\CITECT\BIN>netstat * 8
NetStat, CI Technologies 1992..1994
args [name] [lana]
Lana 8
Netbios not installed
What NETSTAT does is to get basic statistics from the NetBIOS interface. You tell NETSTAT which LanA number you want to look at by passing on the command line. The number 8 above is the LanA number. NETSTAT in this case has display 'Netbios not installed' message as it cannot find a NetBIOS with this LanA number (as 7 is the maximum for Windows 95). When I run NETSTAT * 7 on my computer the following information is displayed:
Permanent node name : 00 00 1b 4e 34 f9
Self Test Result : 00
External jumper setting : 02
Adapter protocol layer version : 255.34
Reporting period : 48 minutes
Free/Maximum/Hardware NCBs : 252/255/255
Pending/Maximum/Hardware Sessions : 2/10/10
Maximum datagram size : 1024
Maximum packet size : 4096
Successful transmits : 19
Successful receives : 6521
FRMR frames Received : 0
FRMR frames Transmitted : 0
I frames received in error : 0
Transmit aborts : 0
Retransmit I frame : 0
Out of receive buffer : 0
Out of transmit buffer : 0
DLC T1 Timer expired : 0
DLC Ti Timer expired : 0
NetBIOS name table entrys : 4
Name : ' MARTIN ROBERTS ' NcbNum(02) Status(04) Registered Unique Name
Name : ' CITSYD ' NcbNum(03) Status(84) Registered Group Name
Name : 'MARTIN ROBERTS _' NcbNum(04) Status(04) Registered Unique Name
From this I know what I have a protocol at LanA=7. I can repeat the command trying all LanA numbers between 0 and 7 to find all the valid numbers. Pressing any key will cause NETSTAT to update it's information and pressing ESC will terminate it. This utility can be used under WFW, Windows 95 and Window NT to find your LanA numbers.
You may ask why I have TCP/IP, IPX and NetBEUI protocols installed on my computer and I don't have any one of them setup as the default (so I cannot tell which protocol is on which LanA number). I am glad you asked that question. The answer is I am running the next to be released version of Citect which supports a new mode of LanA numbers. In Citect version 3.3 and 4.1 you may set the LanA=-1(this will be the default in these versions). When you do this Citect will search for all valid LanA numbers and start using all of them. So in these version you don't have to worry about LanA numbers, Citect will find them for you. The only problem you may encounter with this feature is that Citect will automatically use all protocols with a valid LanA number. You can stop this from occurring by setting the LanA number to the required protocol.
Author: Martin Roberts
What this does not tell you though is that with NT you can allocate Lana numbers yourself. This can be done through the Network Icon in the Control Panel. Go to Services then to Netbios Interface. This will show you a listing of all Lana allocations. You can then change them to any number you need. Then set the appropriate number in your Citect.ini file.
Also with Win95 if you have a DialUp adapter that has TCP/IP on it and it is set to Dynamically Get it IP address from a DHCP server then Citect will not try to use this Lana as it does not have all the information needed to operate properly, unless you are connected to a DHCP server on the dial up connection.
Also because of Plug and Play, Win95 does not necessarily load the protocols in exactly the same order each time. So if you have NetBEUI, TCP/IP and IPX/SPX loaded and have NetBEUI as your Default Protocol, it will always be Lana 0, however there is no sure way to tell which order the other two protocols are loaded in today. They may be TCP/IP then IPX, or they may be IPX, then TCP/IP. Most of the time they will be the same order, but if you rely on that then it will fail one day.
The best solution is to use NT always.
Netbios Window
Once you get your connection between Client and Server working you can see the traffic that is being sent along the network in the Netbios window of the Kernel. On the Server it looks exactly the same as the client at the moment because we have only 1 client, so all the requests are for one Client only. If you have more than one Client there will be more traffic in the Servers Netbios window than on the clients.
Netbios
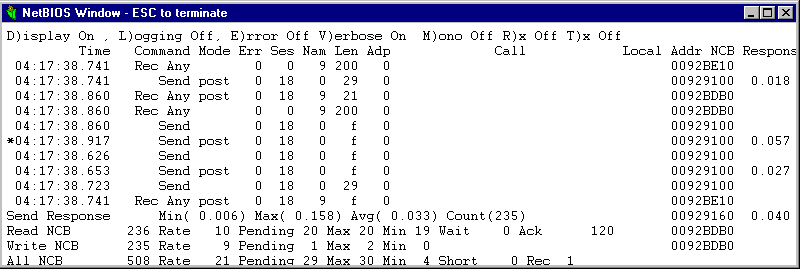
In this window you see a lot of information. The important stuff is the Adp column. This tells you which Lana number this PC is using to communicate. In the case of our Server it is Lana 0, or the Default Protocol.
The other important piece of information here is the response times and other information at the bottom of the table. To see this you must go into Verbose mode by hitting the V key.
The Send Response line shows the Min, Max and Avg times for the cycle of getting a data request and then sending it back on the network. The Read, Write and All NCB lines will show you the usage of the buffers allocated by Citect for networking.
Page Table Tran
The other main table for checking out your network is Page Table Tran. This shows you the list of all connections to and from your PC.
On the Server and Client these will look totally different.
On the server we see the following table.
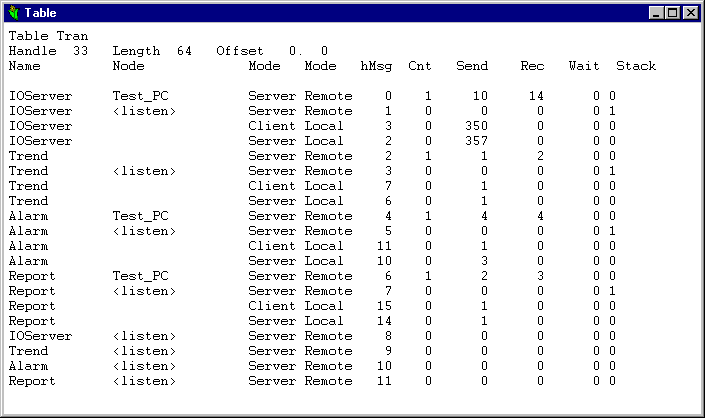
Here you see a listing of all the Netbios Connections this Citect currently has. Also you will see the Server Tasks waiting or Listening for another Client to attach to them.
Name – The type of Server Task
Node – The name of the Citect PC connected or <listen> if this is a Netbios Session that is waiting for another Client to connect. As this Server is using 2 Netbios Capable Protocol stacks there are two sets of listens for each server task it is using. Test_PC is the name supplied by the Client PC while it was running the Computer Setup Wizard as its Computer Name.
Mode - This is either Server, Client or SerRnd. Server means you are being a Server, Client means you are being a Client and SerRnd (not seen here) is for Redundant Server connections.
Mode – This will always be either Remote or Local. If Local it means that this is the connection being used by Your Client, there will always be a corresponding Server Local for this as well. Other Remotes indicate they are connections to a remote Citect Client.
hMsg – The Netbios Session Number (not important here but very useful to know for some Cicode functions)
Cnt – The number of times this Netbios Session has had a connection. This can be important or totally misleading. If the number is high then it can indicate that your network is dropping and then re-establishing Netbios sessions, or it could mean that you just have been running the server for a long time and many clients have started and stopped, thereby closing and opening sessions.
Send and Receive – These are the number of network packets send and received on this particular Netbios Session.
Wait – This is the number of times Citect has had to wait to send or receive data on this session. This number should not go up. If it does you may have to increase the number of buffers available or the size of the ReadPool or Writepool.
Stack – This is the Protocol number. Not the Lana number. Citect orders the protocol stacks like 0,1,2,3 and so on. This is consistent with all versions of windows and lets you see in a glance which protocol stack a client is connected to.
The Clients Transaction Table has the same information but is much simpler as it is only the client.
Here you can see that it is being a Client Remote for each Server task that it needs.
Conclusion
Given this information you should now be able to detect communication bottlenecks in your system and diagnose faulty LAN connections. You should be able to determine the data that a Citect client is requesting, and how long it takes to get that data and from this be able to setup the system to operate at its peak efficiency.
Most of the information you can see in the Kernel will initially be confusing to you. It will be a matter of experience with Citect, Communications in general, Networking with Windows, and general PC/Windows setup that will help you to get the most out of your system. Hopefully this document will help you to understand and utilize the powerful diagnostic information you can gather from Citect’s Kernel.
Remember to use the Help, the KnowledgeBase and userslist@citect.com. These are all exceptionally rich sources of information, and can save you lots of time and effort.
Good Luck and
have fun.
Disclaimer
Disclaimer of All
Warranties
SCHNEIDER ELECTRIC (AUSTRALIA) PTY LTD DISCLAIMS ANY AND ALL
WARRANTIES WITH RESPECT TO SCHNEIDER ELECTRIC (AUSTRALIA) PTY LTD
PRODUCTS AND THE RELATED DOCUMENTATION, WHETHER EXPRESS OR IMPLIED,
INCLUDING SPECIFICALLY THE IMPLIED WARRANTIES OF MERCHANTABILITY
AND FITNESS FOR A GENERAL OR PARTICULAR PURPOSE. CITECTSCADA AND
THE RELATED DOCUMENTATION ARE PROVIDED "AS IS," AND YOUR COMPANY
UNDERSTANDS THAT IT ASSUMES ALL RISKS OF THEIR USE, QUALITY, AND
PERFORMANCE.
Disclaimer of
Liability
YOUR COMPANY AGREES AND ACKNOWLEDGES THAT SCHNEIDER ELECTRIC
(AUSTRALIA) PTY LTD SHALL HAVE NO LIABILITY WHATSOEVER TO YOUR
COMPANY FOR ANY PROBLEMS IN OR CAUSED BY SCHNEIDER ELECTRIC
(AUSTRALIA) PTY LTD PRODUCTS OR THE RELATED DOCUMENTATION, WHETHER
DIRECT, INDIRECT, INCIDENTAL, SPECIAL, OR CONSEQUENTIAL (INCLUDING
LOSS OF PROFITS).
Related Links
Attachments