
Performance tuning of an Ethernet
connection between CitectSCADA
and a Mitsubishi Q-series PLC
Technical Paper
Presented by:
Mark Hoogeveen

Abstract
This paper presents details on performance tuning of an Ethernet connection between CitectSCADA and a Mitsubishi Q-series PLC.
Contacts
support@citect.com
Contents
2. Number of requests/second from CitectSCADA = Number of responses/second from PLC.
2.2 Optimizing the amount of requests
3. Number of responses/second from Q-series PLC
3.1 Actual response time of the PLC for data requests
3.2 Number of Communication Ports
3.3 Method the PLC uses for servicing communication requests
Appendix A : Direct Ethernet connection to a Q-series PLC
Appendix B : Slave connection to a Q-series PLC
1. What is performance?
From a SCADA point of view the performance of a connection can be measured by the amount of data per second that can be received. From a PLC point of view that is the amount of request per second that it can handle.
Every physical link, either serial or Ethernet or other bus type, has a certain maximum throughput. That limit in the number of requests/second is the basis for the performance that can be achieved over this link.
The complete process from requests to response can be quite complex. When the SCADA system requests some information, then that requests is sent from the SCADA software to the Windows layer that can process that request further and put it on the physical link to the PLC. Then the communication port or module on the PLC receives the requests and sends in through to the CPU. The CP U processes this request and sends it back to the communication module, then over the physical link to the Windows PC and then back to the SCADA application. Every step in the link can have an influence on the performance, things like bus speed, PLC scan time, PC CPU load, number of points in your SCADA system etc...
In this article I will try to explain all factors involved, using a Citect – Mitsubishi PLC connection via Ethernet as an example. I will use the following simple equation to look at the performance of a system:
2. Number of requests/second from CitectSCADA = Number of
responses/second from PLC.
1. Problem situation
If you are requesting more than the PLC can deliver then you have a problem. ( I always compare this with a traffic jam on a highway). To overcome this you can either decrease the amount of requests/s generated by Citect, or increase the number of requests/s that the PLC can handle.
2. Room for optimization
If you are requesting less than the capacity of a link, then there is room for optimization. (I always compare this with a quiet hour on a highway). This means you could ask for faster page updates in Citect, faster alarm scan rates, or smaller trend sample times. Of course you do not want to use the full 100% of your bandwidth, since you want to have some spare capacity in case of an exceptional situation (f.e. an alarm burst).
1. Number of requests/second from CitectSCADA
2. How Citect generates requests
Citect will only request the data it needs to operate at a particular moment. To have your system perform at it peak efficiency you should try and make sure that every packet transferred is as full as possible. To do this you need to know how Citect works in regard to gathering IO.
There are really only a couple of steps in the gathering of data. A Client will request the data from an IO Server. If the IO Server still has that data in its cache, and it is fresh enough, it will send the data from its cache in response to the request. If the data is not in the cache, or is stale, then it will request the data from the iodevice. Once it gets the data back from the iodevice it will store it in its cache and at the same time pass it back to the client that requested the data.
This knowledge becomes important when you are trying to work out how to structure your data in the iodevice. Taking into account that all server tasks are clients to the IOServer then you must look at the number of Trends, Alarms and Reports that will be needing data as well as the data that will be needed for each graphics page.
All alarms will be scanned on a regular basis, every [Alarm]Scantime the alarms are polled and evaluated. Trends are similar; every trend sample time the trend data are polled. Usually the alarms and trends will give a continuous periodic load on the system, since every alarm scantime or every trend sample time the same data will be requested.
For graphics pages applies, that only the pages that are currently shown will need to serviced. So the amount of requests that will be generated from graphics pages will vary since usually different pages will be displayed on a system. For a graphics page applied that every [Page]Scantime the data needed for that page is again refreshed.
Due to Citect’s Client/Server architecture all requests for data will end up at the I/Oserver, and this one will get the data from the actual PLC. This also means if two clients requests the same data, then only one request will be sent to the PLC. Also when using I/O server redundancy only the primary I/Odevice will actually communicate with the PLC. Only when the primary I/Odevice fails, the standby I/o device will start communicating to the PLC.
2.2 Optimizing the amount of requests
The amount of requests that are needed depends on how you have blocked your data in the PLC and on how often you request the data. Also by tuning the cache times you can influence the amount of physical requests that are needed to service your system, since some read requests may be answered from memory cache and will therefore not result in any physical requests to the PLC.
2.2.1 Blocking
During compilation of a project Citect will try to generate blocks of requests. Blocking is done per iodevice and per datatype. For example if I request registers D1, D10 and D15, the Citect will try to read only one block of data reaching from D1 to D15. Usually it is much faster to send only one (bigger) request than a couple of smaller ones. This process during compilation time is called static blocking.
For the Mitusbishi Ethernet protocols in CitectSCADA (MELSCNET (for A & AnA series) and MELSCQNA (for Q & QnA series)) applies than one request can contain a maximum of 2048 bits. (This means 128 integers of 16 bits, or 64 longs of 32 bits). One request can only contain one type of data.
All alarms will be scanned on a regular basis, so it makes sense to try and block all the data together for alarms. Trends are similar except that you should try and block all trend data that has the same sample period together. Then, if you have setup some 1, 5 and 30 second trends, each time the Trend Server request this data from the IOServer it can get this data as efficiently as possible from the plc. Blocking these two sets of data together will give you the best performance boost for the smallest effort. So blocking is the first thing to do when you want to increase your data throughput over a link.
Also for graphics pages you can try and block your data in the PLC in contiguous block. However this is usually a much more difficult task, since page usually have a couple of different datatypes and data that may come from different PLC’s, and the data might be spread in the PLC’s.
Citect also has a mechanism of dynamic blocking. This usually has most effect if you have a distributed system with several clients and servers. Dynamically the Ioserver will look at the requests that are generated by all the clients, and will try to block these together to bigger requests. This is controlled via the Block parameter for a protocol.
For the Mitsubishi Q-series [Melscqna]Block defaults to 256 bytes, this is the size in bytes used by the I/O Server to determine if two or more MELSCQNA packets can be blocked into one data request before being sent to the I/O Device.
2.2.2 Scantimes
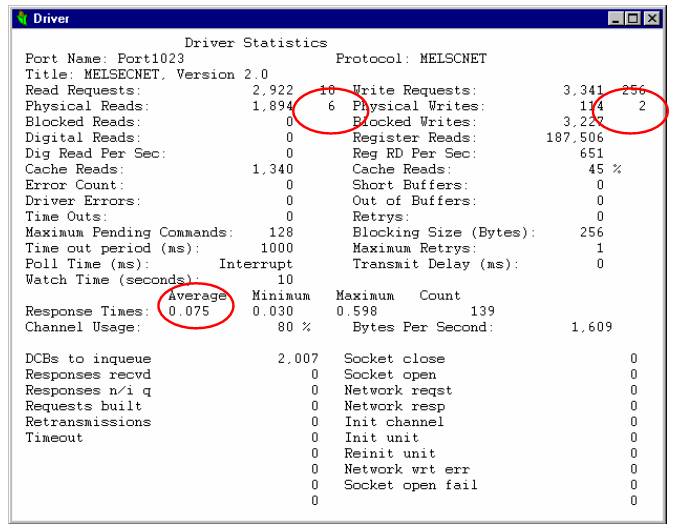
First thing to look at to see if there is a performance problem is ‘Page Driver’ in the Citect Kernel. There you can see the average response time per requests and the amount of read and write requests that are generated, and as well the amount of physical read and write requests.These numbers apply per port.
In the example below you see an MELSCNET statistics for an Ethernet port, with a connection to a Mitsubishi A-series.
There you can see an average response time of 75 ms. You can also see that there are 6 Physical read requests/s and 2 physical write requests/s. This means a usage of (2 + 6)*75 ms = 600 ms to get all these data every second. This means that you are within the bandwidth of your link Easiest way to decrease the amount of requests per second is by setting the [Alarm]Scantime to a higher value than the default of 500 ms. Also if you set your trend sample times to a higher value, then this will also decrease the amount of requests per second.
Another scantime that you can set to a higher value, is the [Page]Scantime. The page scan time sets the default for how often your graphics pages are updated. When a page is updated, all relevant data (variable tags etc.) represented on the graphics page is scanned, to determine if field conditions have changed. A (default) value of 250 indicates that CitectHMI/SCADA will try to update the page every 250ms.
For most systems a value of 1000 ms for the page scan time is also fine, since most operators take at least a second to notice a change and act upon it. The [Page]Scantime can also be set dynamically via the PageSetInt(-2,) Cicode function. However when you change pages, it will again have the old setting as configured for your page.
2.2.3 Caching
The third option to tune the amount of physical requests that are generated by Citect is the caching mechanism.
On large networked systems with many Display Clients, you can improve communications turnaround time by using memory caching. When caching is enabled, all data that is read from a I/O Device is stored temporarily in the memory of the I/O Server. If another request is made (from the same or another Display Client) for the same data within the cache time, the Citect I/O Server returns the value in its memory - rather than read the I/O Device a second time. Data caching results in faster overall response when the same data is required by many Display Clients.
A cache time of 300 milliseconds is set by default when you configure an I/Odevice. You can change this in the (extended) I/Odevice form in the Citect Project Editor or during runtime from the Kernel. You should avoid using long cache times (in excess of 1000 milliseconds), because the data can become 'stale'.
NOTE: You can not use data caching for Memory or Disk I/O Devices, as Memory I/O Devices are not shared on a LAN and not serviced by an IOServer, and caching Disk I/O Devices is a waste of memory as File Caches do the same thing but better.
How It Works
Unnecessary reads can be generated when one client requests the I/O Server to read data from the PLC. The I/O Server reads the data from the PLC and passes it back to the first client. Just after the I/O Server has sent the data back to the first client, the second client requests the same data. The I/O Server must now do another read of the PLC, which could have been serviced by the first read. If the I/O Server received the second client’s request before the PLC data was returned, it would have automatically optimised the read - by sending the same data back to both clients (Page General | Blocked Reads shows this count).
The unit cache will fill in the gap of the requests between the two clients. If the cache time is set to 300ms, the second client can make a request to the I/O Server up to 300ms after the I/O Server has sent the data back to the first client, and still get the same data. Note that the two clients don't have to be two different Citects on a network, they may be the alarms and trend clients in the same computer, so this tuning will affect even a single node system.
Tuning
The cache should be tuned large enough so that unnecessary reads are not generated, and small enough that old data is not returned while keeping the communication channel busy. If the cache is too large, the communication channel may become idle for short periods of time and so waste its bandwidth.
Also if the cache is too large, a Citect client may start to short cycle on reads request, which will generate unnecessary network or internal traffic load.
Read short cycling occurs when a client requests data from the I/O Server, and the data is returned from the cache, so it is returned very quickly. The client will process the data, e.g. display it on the screen (also very quickly), and then ask for the same data again. If the I/O Server again returns the same data from the cache, the client will process the same data again which is redundant and a waste of CPU and the network (to transmit the request and response). When short cycling starts to occur, the CPU and network loading will rise.
Tuning the cache is a trial and error process - as you change it, the read cycle time will also change. The cache time will also depend on what the current PLC traffic is. The current traffic is dynamic as Citect will only read what is required depending on the current page, trend, alarm and reports running. You should always be on the safe side and set the cache a bit lower to stop short cycling under lower loading conditions.
To tune the cache you must balance the cache time between unnecessary reads and short cycling.
Use the following method:
NOTE: This information assumes to know how to use the Citect debugging kernel.
1. Turn off all unit caching, use the CACHE command in the kernel so you don't have to recompile your project. (CACHE * 0 will set the cache for all iodevices to 0).
2. Run one Citect client only on the network, use the Client in the I/O Server for the test.
3. Display a typical page to generate normal PLC loading for your system.
4. In the kernel use the STATS command to reset all the Citect statistics.
5. In the kernel display the page 'PAGE TABLE STATS'. This page shows the cycle and execution time of various Citect tasks, some of which consume PLC data. The tasks called 'Citect n' where n is a number (0 for the first instance of a window, 1 for the next open window, and so on) are the tasks that get data from the PLC and display on the screen. Look at the Avg Cycle time; this is the third column from the left. Assume that the Avg cycle time is 1200 ms. T his will mean that the current page is gathering all PLC data and displaying its data on the screen in 1200ms.
6. The cache time should always be below this average cycle time to prevent short cycling. On average it should be less than half this time, i.e. 600 ms.
7. Set the cache time to half the cycle time (600ms). You may not see any improvement in performance with a single client, as caching will only improve performance with multi clients. You may see improvements is you are also running trends, alarms or reports which are requesting the same data.
8. You should then add another Citect client, which is displaying the same data. Reset the STATS and check the Average cycle time. Each new client should not increase the cycle time, it should drop slightly. Also look at PAGE GENERAL, to see that each new client should service its reads from the cache, i.e. the % cache reads increases.
9. If the average cycle time drops to less than half the original time then short cycling is occurring and you should decrease the cache time until this stops.
3. Number of responses/second from Q-series PLC
It is also fairly important as to how the communications ports are supported in the PLC. If they go directly into the CPU then it will generally be faster than if you are connecting via an interface card in the PLC rack. If it is via an interface card in the rack you are then restricted to the speed of the bus of the rack and how much data it can transfer per scan.
The actual BAUD rate, or Bits Per Second (bps), of the communications link does not play a very significant role in your overall response times from the PLC. As the bps increases the real world increase in data throughput in a SCADA system does not increase proportionately.
As a very rough example, consider the following table.
|
Transmission Type |
Approximate Bits Per Second |
Bytes to Transfer |
Approximate Time to transfer |
|
Serial 9600 |
10,000 |
10 |
10 Milliseconds |
|
Serial 19200 |
20,000 |
10 |
5 Milliseconds |
|
Ethernet |
10,000,000 |
10 |
0.01 Milliseconds |
So you can see that from doubling your BAUD rate from 9600 to 19200 you gained 5 milliseconds. By then multiplying your transmission speed by a factor of 500 you gained nearly 5 milliseconds.
A much more important factor is the actual response time of the PLC supported.
3.1 Actual response time of the PLC for data requests
This can be very difficult information to get. It is fairly doubtful that someone who is trying to sell you a PLC will tell you that it has a long response time. This information should be available with the specifications of the PLC. If not try and get the answer out of the manufacturer, otherwise you can use Citect to check this out. You can get accurate response times directly from the Kernel, although these times are more from the point of view of Citect. They typically measure the complete round trip time between Citect asking for data and getting the response packet.
If you can find out how long the PLC should take to process data requests and you can see in Citect the response times, you can then work out the time delay that is being produced by any other factors, such as cabling, interface cards etc. This is probably the most important item of data you need. If the PLC you are looking at takes a long time to process request for data, then nothing you ever do in Citect will make your system faster. If the PLC can process and respond to requests for data within 12 ms or less then you will be well on the way to a very fast system. This is typically tied directly to the actual Scan Time of the PLC. This will probably increase, as your program grows larger. Some PLC’s will allow you to set a scan rate that they will stick to; others will run as fast as they can.
The impact that this time will have on your system is illustrated in this simple example;
If your PLC has a scan time of 100ms, and it services communications request at the end of each scan. Then you will get an average time of 50ms for the period between the PLC receiving the request for data and sending the response. The actual time for each request will depend on how far the PLC is through its Scan when the request arrives. If it is near the end of the scan, the request may only wait 1-2 ms, if it has just started a new scan then the request may wait for 98-99 ms.
In case of the Mitsubishi PLC’s it is important to know that PLC’s directly connected to Citect via Ethernet have a much faster response time than slave PLC’s that are connected via a master PLC and a sub network such as MelsecNet B and MelsecNet 10. To improve the performance of data of slave PLC’s you can use so called B and W network registers. These are registers that reside in the master PLC, and that are update by slave PLC’s automatically when a change has occurred for those data. This means you are no longer talking to the slave PLC’s directly but rather via the B’s and W’s in the master PLC. Especially for MelsecNet B this important, since it is quite a slow network.
3.2 Number of Communication Ports
If you have only 1 port for communications on the PLC then you will most likely not be able to use Citect and any other software package, such as your programming software, at the same time.
If the PLC has two or more communications ports then it is much easier to setup a redundant Citect system, as each IO Server will have their own communications port. There will be no conflict over which PC is the current one doing the talking.
This is really only going to have an impact on your response times if you do need to use both ports at the same time. If you do need to do this then you should check to see if the PLC will slow down its responses in relation to how many of the communication ports are being used simultaneously. Many PLC’s will virtually double their response times if they need to service requests for data from two ports simultaneously.
If this is a necessary point for your system then usually the PLC’s that have a dedicated communications interface card will not suffer, but they will still have the problem where they are limited to the bandwidth of the bus speed of the rack.
In case of the Mitsubishi Q-series can use up to 8 TCP (or UDP) ports, since the E71 Ethernet module has 8 ports. In case you use more than one port the response time per port will drop but the overall throughput will be better. (There is now even a new E71 module with 16 ports).
As an example via one QnA port I could get a response time of 40 ms per request, and when I used 8 ports it came down to 100 ms per request. But overall it was better since now I was using 8 ports. (Previously it was a maximum of 25 requests per second and now it is 8 x 10 = 80 requests per second.)
|
response time/requests |
page update time |
|
|
1 direct tcp port used on QnA |
40 ms |
3,0 s |
|
8 direct tcp port used on QnA |
100 ms |
1,5 s |
If I used a new Q-series PLC the response time per request, when using 8 ports in parallel, was 50 ms. So the Q-series is about two times as fast at the QnA-series (when using the same PLC project and scantimes).
When using multiple ports, please be aware that for a redundant situation you need one TCP port for each iodevice. The first iodevice that connects will claim that TCP port on the PLC Ethernet module. If you use UDP as protocol then you do not have this disadvantage, and you can have multiple iodevices connected via the same port. This is because TCP is connection oriented and UDP is not.
3.3 Method the PLC uses for servicing communication requests
This is going to influence directly the response times of your PLC. Some PLC’s will wait until the end of a scan and then service 1 request. Some will wait until the end of a scan and service multiple requests.
Some will service requests (including writes) at any time through the scan. If at all possible get one that can service multiple requests for data in one scan. This will mean that the protocol can support multiple data requests, and the whole system can respond faster. Some PLC’s allow you to allocate a certain percentage of CPU time for communication processing – tuning this may yield better response.
The ideal PLC for very high performance will be one with a very fast scan (powerful CPU), able to service multiple requests for data, has communication ports that directly access the CPU or memory of the PLC and is easy to setup. Bear in mind the relative benefits to be gained here. It may not be worth the hassle setting up a machine that has all these capabilities. Some boxes have many parameters that you need to get exactly right for them to work to potential; something that is just as fast or only 1-2% slower yet has little or no configuration involved is obviously the better proposition.
One other point that may have an influence really doesn’t have anything to do with pure performance, but ease of use and flexibility. Try and choose components that adhere to some type of open standard, particularly for communications. This will make everything much easier to troubleshoot later and will hopefully not lock you in to any one manufacturer. This is one of the main reasons that Ethernet communications is so popular. The Interface cards are cheap, the technology is matured and very well proven, the problems with it are well documented and there are many tools available for investigating and managing Ethernet based networks. Ethernet may not give you the best performance, but it will not be far off and is a lot more flexible and cheaper than most proprietary networks.
For the Mitsubishi Q-series we use their so-called 3E Frame Type protocol to talk the Ethernet modules. When you receive a response with this 3E Frame type, in the response itself no information is contained which data type the data are for. This means we must wait for an answer before we can send out the next requests. If we would not do that that me might mismatch two responses, since in the response I can only see the raw data, and only thing to discern two responses from each other is the expected data length of a message. This also means that the [Melscqna]MaxPending parameter is set to 1, since only one requests can be outstanding (per port) at any one time.
The E71 Ethernet module in the PLC does not support multiple outstanding requests. However you can use the 8 TCPIP communication ports in parallel to get a better throughput. See the numbers in section 3.2.
Although these two last point sound negative, we should look at the actual performance that can be achieved over an Ethernet link from Citect to a Mitsubishi Q-series PLC, when using properly blocked requests. We used a test application with 960 integers on one page (ranging from D1 – D9591) that could be served via 75 requests. In those 75 requests a total of 9600 integers is read via blocked reads. (Each blocks has the maximum size of 128 integers; 128 * 16 = 2048 bits).
When using 8 parallel ports I could read these 9600 integers in ca. 500 ms. After tuning the cache this came down to 400 ms. This was measured via Page Table Stats in the Kernel.
This is actually an amazing performance if you can read ca. 10000 integers within 0,5 s !.
4. Summary
Hereby a short summary of the concrete actions you can do to improve the performance and response times of your connection from CitectSCADA to a Mitsubishi Q-series PLC via Ethernet.
4.1 Actions on PLC side
With existing hardware:
- Use more communication ports on the Ethernet module -> this leads to more parallel communication paths. Standard Ethernet modules for Q-series have 8 TCP/UDP ports; there even exists a new one with 16 ports.
- Use the new, faster Q-PLC in stead of a QnA PLC -> this leads to faster response times per port
- Use B and W registers when communicating to slave PLC’s via a Melscnet-B or Melscnet-10 subnet -> this leads to faster response times for data from the slave PLC’s \
- Use UDP instead of TCP -> this leads to faster response times per port. UDP is ca 20% faster than TCP from the PLC Side. (In Citect you need to use the –U option in the port special options).
- Improve the blocking of tags in contiguous blocks -> This leads to less communication requests to get all required data.
Using new hardware:
- Use a dedicated network (separate from office LAN) for the connection between Citect and the PLC’s -> this leads to less collisions on the network
- Use more Ethernet cards in the PLC. This can be either in slave PLC’s or master PLC’s -> this leads to more parallel communication paths.
- Use a full duplex, switched network architecture -> Higher throughput over network, since you have dedicated lines for sending and receiving
4.2 Actions on Citect side
- Improve blocking -> less data requests needed to get the required data.
- Tune your cache times of your I/O devices -> This leads to less physical requests to the PLC, since more requests can be answered form cache.
- Look at the necessary/allowable scantimes for alarms, trends and pages -> If you increase the [Alarm]scantime, [Page]Scantime or the trend sample times, then this will results in less physical requests per second to the PLC.
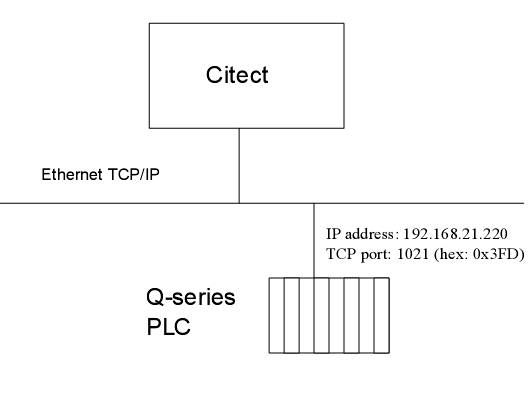
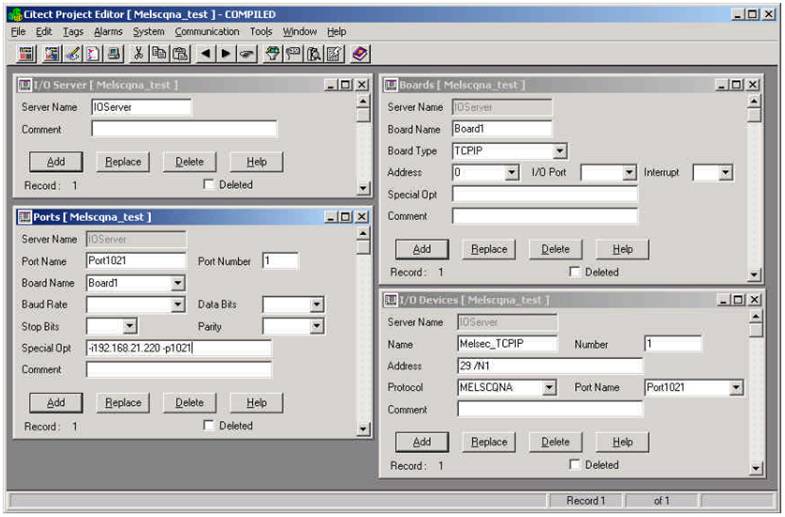
Appendix A : Direct Ethernet connection to a Q-series PLC
Example of Citect configuration for a direct Ethernet connection to a Q-series PLC. In that case you always you use 255 as address for the I/Odevice.
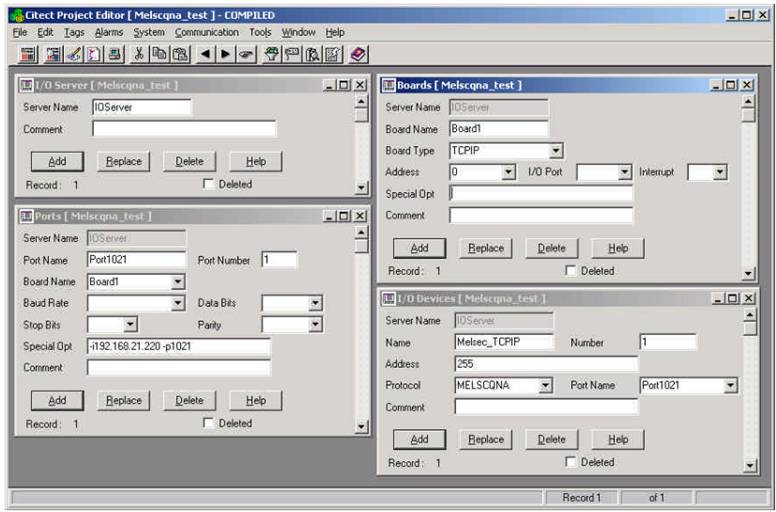
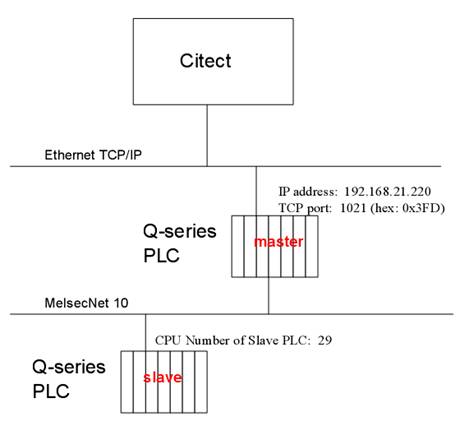
Appendix B : Slave connection to a Q-series PLC
Example of Citect configuration for an indirect Ethernet connection to a slave PLC via a Q-series master PLC. The Q-series slave PLC is connected via a MelsecNet-10 sub network to the master PLC. In this case you use the CPU Number of the slave PLC as address for the I/Odevice.
Disclaimer
Disclaimer of All
Warranties
SCHNEIDER ELECTRIC (AUSTRALIA) PTY LTD DISCLAIMS ANY AND ALL
WARRANTIES WITH RESPECT TO SCHNEIDER ELECTRIC (AUSTRALIA) PTY LTD
PRODUCTS AND THE RELATED DOCUMENTATION, WHETHER EXPRESS OR IMPLIED,
INCLUDING SPECIFICALLY THE IMPLIED WARRANTIES OF MERCHANTABILITY
AND FITNESS FOR A GENERAL OR PARTICULAR PURPOSE. CITECTSCADA AND
THE RELATED DOCUMENTATION ARE PROVIDED "AS IS," AND YOUR COMPANY
UNDERSTANDS THAT IT ASSUMES ALL RISKS OF THEIR USE, QUALITY, AND
PERFORMANCE.
Disclaimer of
Liability
YOUR COMPANY AGREES AND ACKNOWLEDGES THAT SCHNEIDER ELECTRIC
(AUSTRALIA) PTY LTD SHALL HAVE NO LIABILITY WHATSOEVER TO YOUR
COMPANY FOR ANY PROBLEMS IN OR CAUSED BY SCHNEIDER ELECTRIC
(AUSTRALIA) PTY LTD PRODUCTS OR THE RELATED DOCUMENTATION, WHETHER
DIRECT, INDIRECT, INCIDENTAL, SPECIAL, OR CONSEQUENTIAL (INCLUDING
LOSS OF PROFITS).
Related Links
Attachments