
Using Performance Monitor
(PerfMon)
Technical Paper
Presented by:

Abstract
Performance
Monitor is very useful for tracking and logging statistical data
such as memory usage over time both locally and remotely. The
graphical interface allows quick inspection of the data and it can
also be exported for further analysis with graphing tools such as
those available in Microsoft Excel.
Contacts
support@citect.com
Contents
Using Performance Monitor (PerfMon) 3
Example Usage.
4
Performance
Monitor is very useful for tracking and logging statistical data
such as memory usage over time both locally and remotely. The
graphical interface allows quick inspection of the data and it can
also be exported for further analysis with graphing tools such as
those available in Microsoft Excel.
Performance
Monitor can be launched from Control Panel | Administrative Tools |
Performance. You can add counters, configure log files and schedule
future logging.
The following
snapshot illustrates setting memory tracing for Citect
runtime.
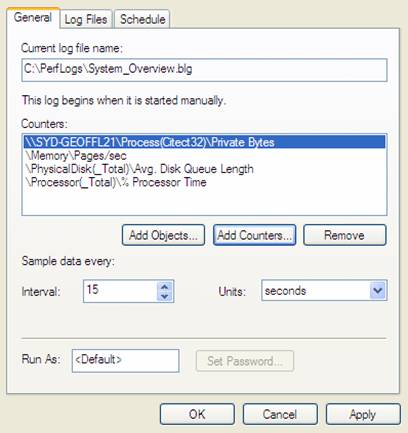
To obtain logs
from your PC showing the Private Bytes, Virtual Bytes usage of
Citect32.exe as well as the overall CPU usage:
You'll need to
do the following to setup a counter log for Citect32's Private
bytes:
1) Start
Citect Runtime (Citect32.exe).
2) Either type
‘perfmon’ at the command line or in your Control Panel, select
Administrative Tools->Performance (You'll need to be an
Administrator to access this).
3) Select
"Performance Logs and Alerts"->Counter Logs from the left hand
pane.
4) Right-click
on the Counter Logs and select "New Log Settings"
5) Give the
log settings a name (eg. Citect Logs)
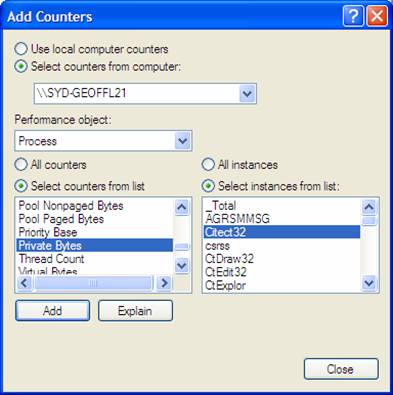
6) Click on
"Add Counters..."
7) Select
"Process" as the Performance Object, select "Private Bytes" as the
counter, and select "Citect32" as the Instance, then click "Add".
You should also add counters for "Thread Count", "Virtual Bytes"
and "Handle Count". Selecting "Processor" from the performance
Object lists will allow you to add "% Processor Usage" as another
counter.
8) Click on
Close
9) Select the
"Log Files" tab and change the log file type to "Text file (comma
delimited)"
10) Click OK
to save the log settings
11) If the
Citect Logs Icon is not green (ie. running), right-click on "Citect
Logs" and select "Start"
Disclaimer
Disclaimer of All
Warranties
SCHNEIDER ELECTRIC (AUSTRALIA) PTY LTD DISCLAIMS ANY AND ALL
WARRANTIES WITH RESPECT TO SCHNEIDER ELECTRIC (AUSTRALIA) PTY LTD
PRODUCTS AND THE RELATED DOCUMENTATION, WHETHER EXPRESS OR IMPLIED,
INCLUDING SPECIFICALLY THE IMPLIED WARRANTIES OF MERCHANTABILITY
AND FITNESS FOR A GENERAL OR PARTICULAR PURPOSE. CITECTSCADA AND
THE RELATED DOCUMENTATION ARE PROVIDED "AS IS," AND YOUR COMPANY
UNDERSTANDS THAT IT ASSUMES ALL RISKS OF THEIR USE, QUALITY, AND
PERFORMANCE.
Disclaimer of
Liability
YOUR COMPANY AGREES AND ACKNOWLEDGES THAT SCHNEIDER ELECTRIC
(AUSTRALIA) PTY LTD SHALL HAVE NO LIABILITY WHATSOEVER TO YOUR
COMPANY FOR ANY PROBLEMS IN OR CAUSED BY SCHNEIDER ELECTRIC
(AUSTRALIA) PTY LTD PRODUCTS OR THE RELATED DOCUMENTATION, WHETHER
DIRECT, INDIRECT, INCIDENTAL, SPECIAL, OR CONSEQUENTIAL (INCLUDING
LOSS OF PROFITS).