| Applies To: |
|
| Summary: |
|
Memory corruption, when it occurs, will generally lead to a crash in CitectSCADA. Unfortunately, however, the crash may well occur at some location totally unrelated to where the problem first occurs, and so memory corruption issues can be notoriously difficult to track down. This article describes the use of one tool that helps us narrow the gap between where the problem occurs and where it is first noticed (usually in the form of a crash). |
| Solution: |
|
Debug Diagnostics is a tool produced by Microsoft that is useful in a range of debugging scenarios. It can be downloaded for free from Microsoft's website. The following procedure will enable full page heap verification for the Citect32.exe process. 1. Start up Debug Diagnostics. By default you will immediately be presented with a wizard for adding a rule. If not, click on the "Add Rule..." button. 2. Select "Crash" and click Next.
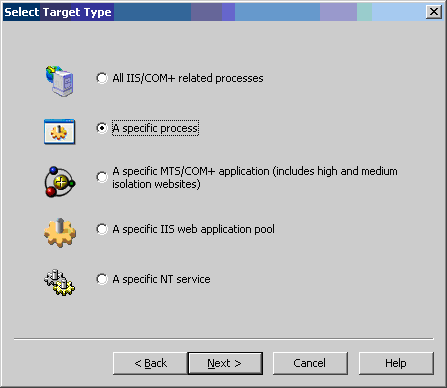
3. Select "A specific process" and click Next.
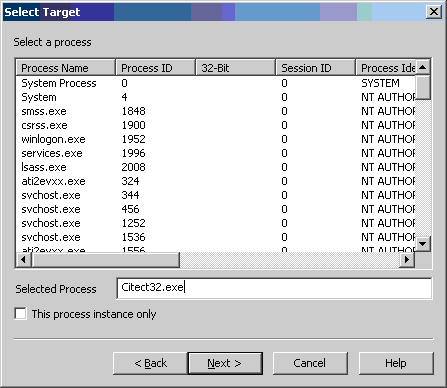
4. Type in the name of the process you wish to monitor (e.g. Citect32.exe) and click Next.
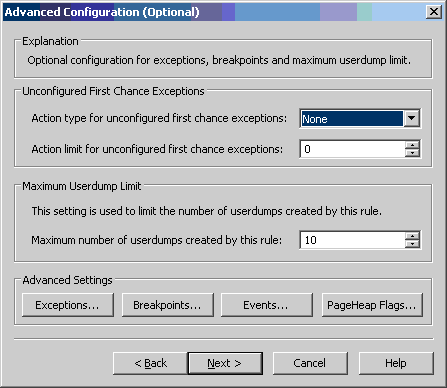
5. The default settings on the next page should be OK, unless otherwise advised by Citect support. Click on "PageHeap Flags...".
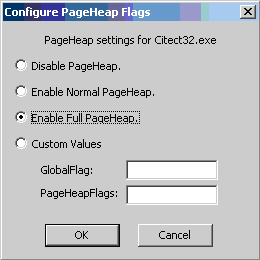
6. Select "Enable Full PageHeap" and click OK. You will be presented with a warning to the effect that enabling Full PageHeap has performance ramifications - please see the warning at the end of this article for more details.
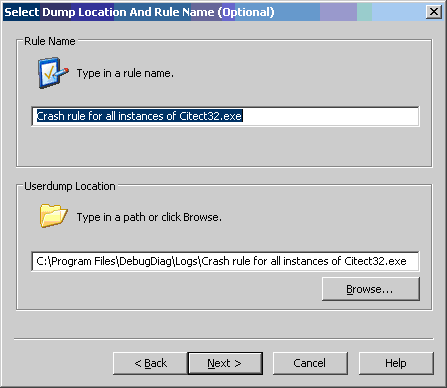
7. You may wish to choose the location that you wish the resulting dump files to be placed by entering a Userdump location. Otherwise just click Next.
8. Click Finish.
9. Start the process with the suspected memory corruption and wait for it to crash. Retrieve the generated process dump file from the location nominated in Step 7 above and return to Citect Support for analysis. Warning: Following this procedure will cause the Citect32.exe process to consume considerably more memory than would normally be the case, and so may not be suitable for extremely large projects. If this is the case, the following mitigations may allow you to continue. They are listed in order of preference from a debugging point of view:
|
| Keywords: |
Related Links
Attachments


