Applies To:
  • CitectSCADA
  • VijeoCitect
  • CitectHMI 

Summary:
In some very rare occasions, when Citect runtime crashes, it does not generate an Exception report. Even the user.dmp generated by Dr. Watson is unusable. So how should we gather more information when it happens?

Solution:
We can monitor Citect Processes using Debug Diagnostic Tool.
  

Please download Debug Diagnostic Tool 1.1 at the following URL:

http://www.microsoft.com/downloads/details.aspx?FamilyID=28bd5941-c458-46f1-b24d-f60151d875a3&displaylang=en

Please note that the above link will download an English version of the tool, you can change your language preference on the page.

Please run the installer when you finish downloading.


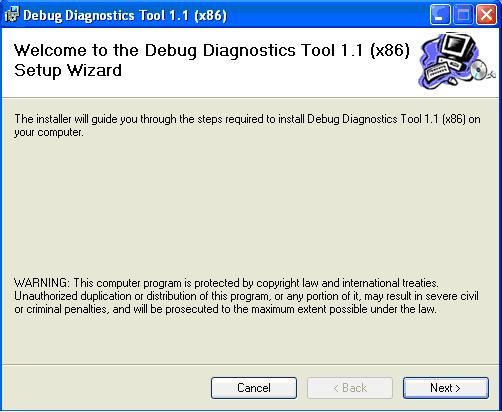
Figure 1: Installation screen


Debug Diagnostics Tool is easy to install, you just need to follow the installer.


After installing it, you should be able to find it in your start menu, start à all programs à Debug Diagnostics Tool 1.1 à DebugDiag 1.1 (x86)


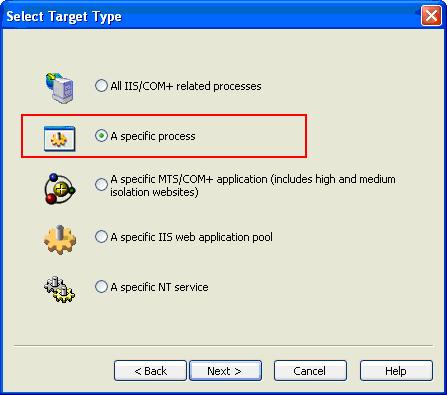
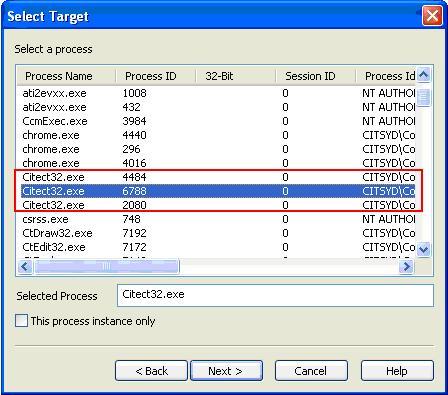
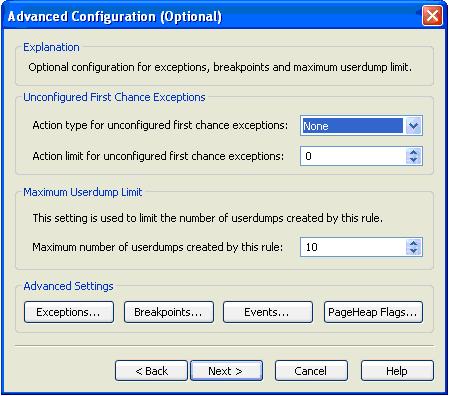
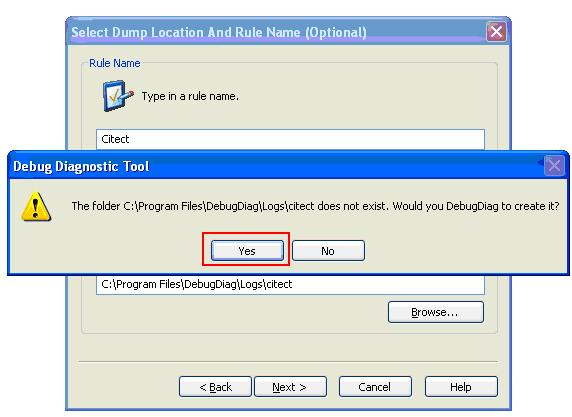
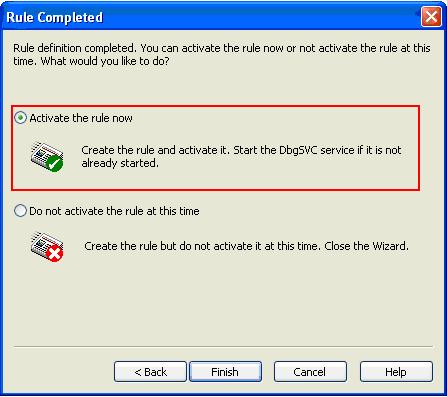
Here are the steps of how to configure Debug Diagnostics Tool, to setup a rule and monitor Citect runtime.


  1. Please make sure Citect runtime is running.
  2. Start Debug Diagnostics Tool, then choose “Crash” rule type and press next.

    Figure 2: Choose Crash
  3. Select “A specific process” target type and click next.

    Figure 3: Choose “A specific process”
  4. In the “Select Target” Window, please choose Citect32.exe. If you are running Citect in Multi-process mode, choose any one of the Citect32.exe in process list. DO NOT tick “This process instance only” 


    Figure 4: Select Citect32.exe

  5. Click “Next”, for the purpose of this KB, do not change anything in the “Advanced Configuration (Optional)” Window.


    Figure 5: Click Next

  6. For the rule name, give it any descriptive name and select/type a location for it.


    Figure 6: Give it a name and location

  7. If the location/path does not exist, it will give you a warning message, click “Yes”.


    Figure 7: Click “Yes”

  8. Choose “Activate the rule now” then click “Finish”. After you clicking finish, you should expect a delay, or freeze up to about 10 seconds. This will not affect the Citect runtime nor create any performance issue.


    Figure 8: Choose “Activate the rule now”

  9. Leave Debug Diagnostics Tool running, DO NOT close the window. If Citect crashes again, you should be able to find a dump file at the location defined in step 6


    Figure 9: Dump file generated by Debug Diagnostics Tool

NB: DO NOT USE THIS METHOD UNLESS INSTRUCTED BY CITECT SUPPORT.


Keywords:
 Crash, Crashes, user dump

Attachments