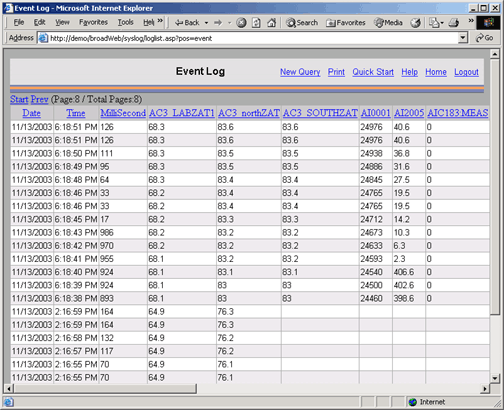
Similar in concept to a Sequence of Events Recorder, The Event log will log user-defined number of sample before the event and after the event. The data is logged to an ODBC database on the Project Node.
Up to 22 Tags can be logged to a single Event Log based on the status of a single tag (the Event Tag). Resolution can be from 1 millisecond to 1 hour. The Actual resolution depends on you computer hardware, network connections and communications to field device (e.g. PLC). Multiple Event Logs can be configured.
Event Types that will trigger logging include:
Event Tag >= Reference Value
Event Tag <= Reference Value
Event Tag >= Reference Tag
Event Tag <= Reference Tag
Record Every Sample Interval

Event Log
An HTML report is printed.
Project Users can view an Event Log from the Project Manager.

Power
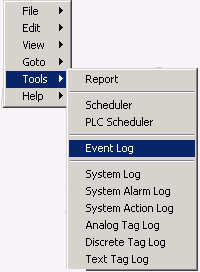
Users can also see Event Logs from VIEW using the Tools
menu:
Right Click -> Tools -> Event Log.

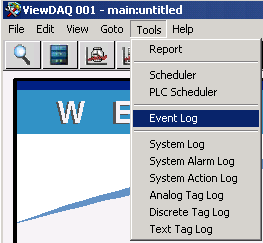
All Users can also see this Action Log
from ViewDAQ using the menu bar:
Tools -> Event Log.

The time of
"Time” Event Log data (i.e. ‘Record every sample period’) now
aligns to 00:00:00 regardless of when the SCADA node
started.