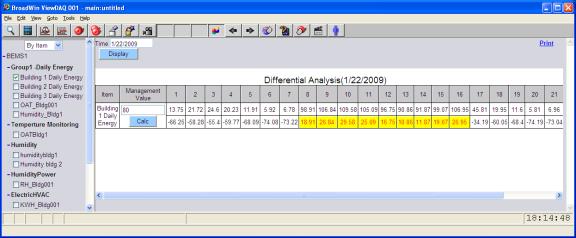
Differential Analysis calculates the displays energy use for each hour and calculates the difference with a Management Value (i.e. target value). The periods exceeding the Management Value have their difference highlighted in yellow.

Figure 1.8 – Differential Analysis of energy use in Building 1 versus a user entered Management Value (a target value).