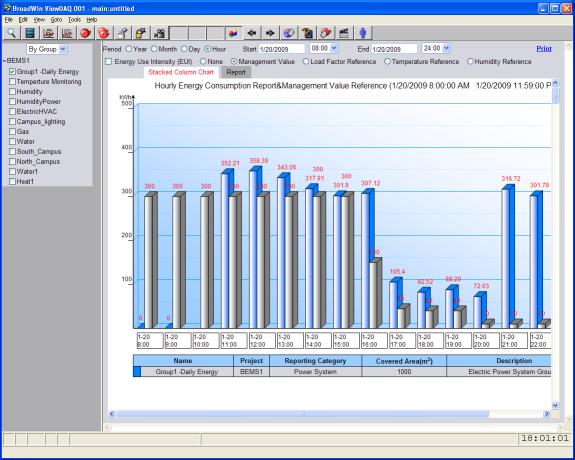
Management Values allows the use of reference values to compared against actual values shown in the Energy Profile display. Typically these are the average, expected or desired values for each Item or Group. The Management Value is typically a Gray Column drawn next to the Actual Energy use in the Energy Profile Display. It shows in only the Stacked Column Chart of the Energy Profile (and not in the report).
Figure 3.14 – Energy Profile with Management Value in Gray, the measured value in Blue
Management Values can be assigned for on various time basis:
· Each Hour of the Day, including Summer and Normal Hours
· Each Day of the month, for each month of the year
· Each month of the year
· Each Year from now to 2040