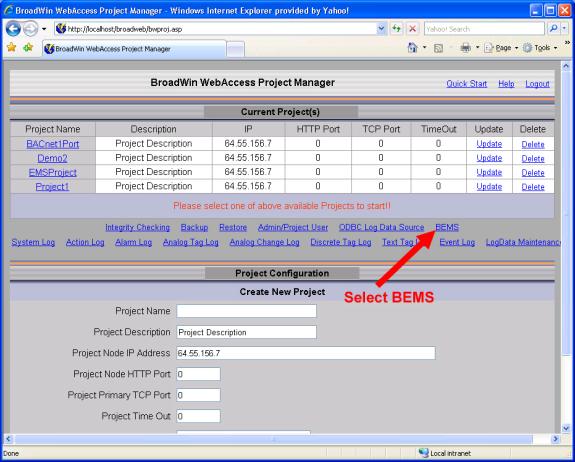
The BEMS Project Manager is inside the WebAccess Project Manager.
This uses only port 80 (or whatever you assigned as the http port). The client plug-in is not needed, so this maybe an option for those unable to install the plug-in or unable to connect via the Primary and Secondary TCP ports (default 4592 and 14592) because of firewalls. However, only Admin and Project Users can view BEMS from the BEMS Project Manager.
The toolbar and status bar in VIEW and ViewDAQ are also eliminated using this method, allowing more area on the screen and being a little less cluttered if screen captures are used.
Also, using the BEMS Project Manager, the BEMS displays can be viewed even if yhe SCADA node is not running or is offline.
If you have not already done so, connect to the Project Node and Start WebAccess Configuration.

Figure 4.1 – BEMS in Project Manager
Select BEMS hyperlink in the WebAccess Project Manager to start the BEMS Project Manager.
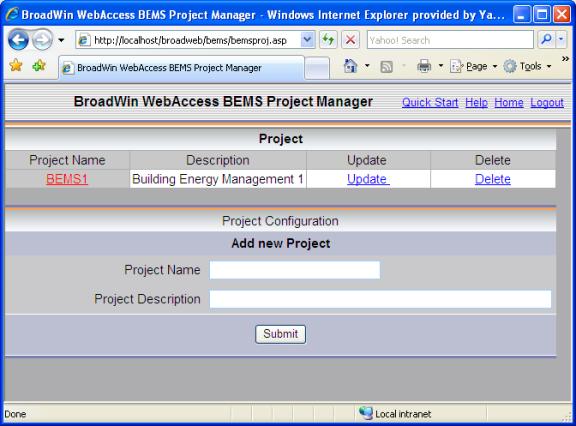
Figure 4.2 – BEMS in Project List
Select name of the BEMS Project ( BEMS1 hyperlink in the above example).
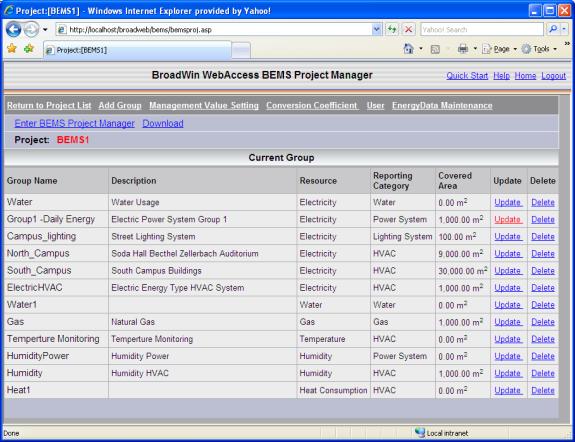
Figure 4.3 – BEMS Group List
Select name of the BEMS Project Enter BEMS Project Manager hyperlink from the Group List.
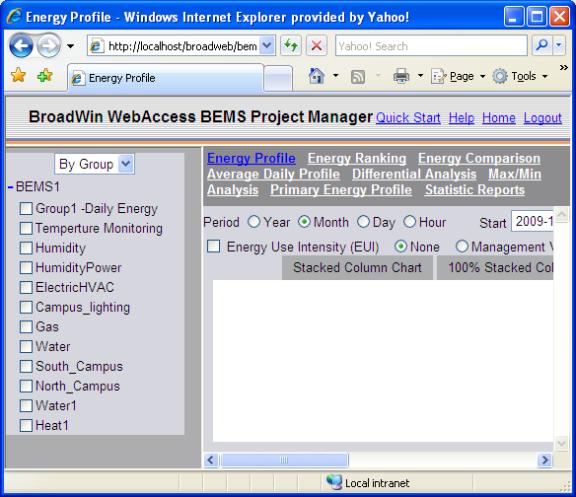
Figure 4.4 – BEMS Display Viewer,. By Group, nothing selected.
Select By Group to display all the energy in a group (for example, all the Buildings in the North_Campus Group).
Select By Item to select individual energy usage items.
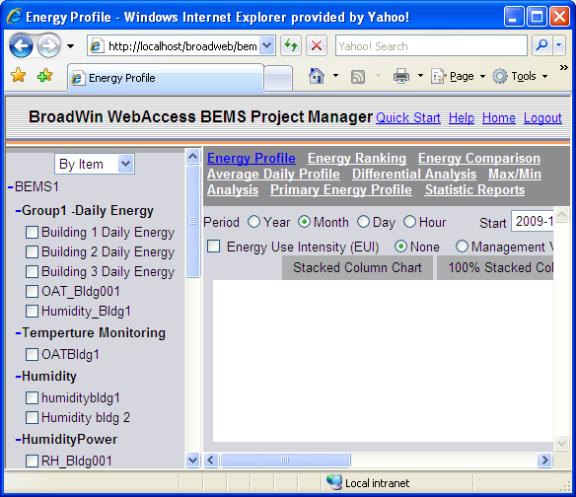
Figure 4.5 – BEMS Display Viewer, By Item, nothing selected
Select an Item or Group.
Select an Analysis Display (Energy Profile, Energy Ranking, Energy Comparison, etc).
Select a time Period (Year, Month, Day, Hour).
Select Start and End Dates and/or times.
Select Chart type (Stacked Column, 100% Stacked Column, etc).
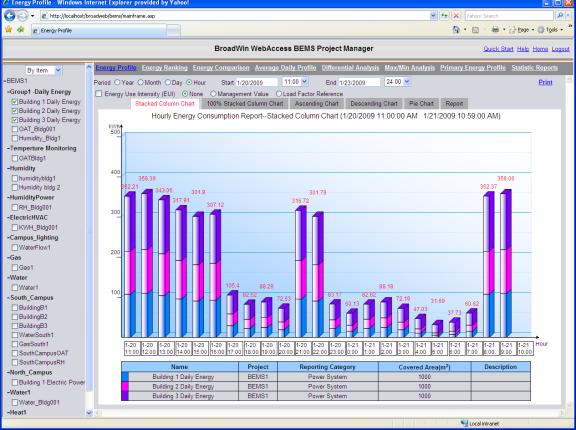
Figure 4.6 – BEMS Display Viewer, By Item, Hour data, Stacked Chart
To add items or change time, make the change and select the Chart Type tab again (Stacked Column, 100% Stacked Column, etc). The chart should redraw whenever the Chart Type tabs are selected.