This uses WebAccess VIEW in Internet Explorer. This method requires the Client Plug-in and access over the Primary and Secondary TCP ports (default 4592, 14592) and the http port (default 80). The SCADA node must be running .
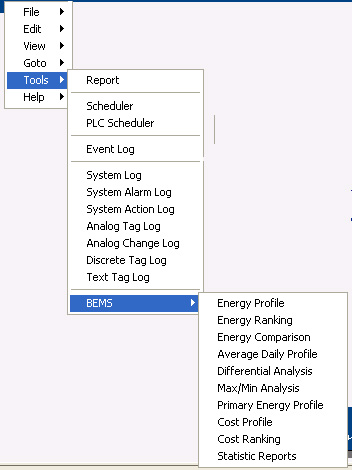
Currently only Power Users and Admin can view BEMS displays in View. The default method is from the Right Click, Tools menu ( Right Click -> Tools -> BEMS). Then select an Analysis Display (Energy Profile, Energy Ranking, Energy Comparison, etc).
Right Click -> Tools -> BEMS

Figure 4.7 VIEW Client – Right Click Menu for Primary Energy Profile
Select an Item or Group.
Select a time Period (Year, Month, Day, Hour).
Select Start and End Dates and/or times.
Select Chart type (Stacked Column, 100% Stacked Column, etc).

Figure 4.8 VIEW Client – Energy Profile
To add items or change time, make the change and select the Chart Type tab again (Stacked Column, 100% Stacked Column, etc). The chart should redraw whenever the Chart Type tabs are selected.
To change the Analysis Display (Energy Profile, Energy Ranking, Energy Comparison, etc), use the Right Click Menu again.