
In ViewDAQ, all uses of ViewDAQ can view BEMS displays. The default method is from the Tools menu on the upper menu bar.
Figure 4.9 ViewDAQ – Energy Profile
From Tools select BEMS, then select an Analysis Display (Energy Profile, Energy Ranking, Energy Comparison, etc).
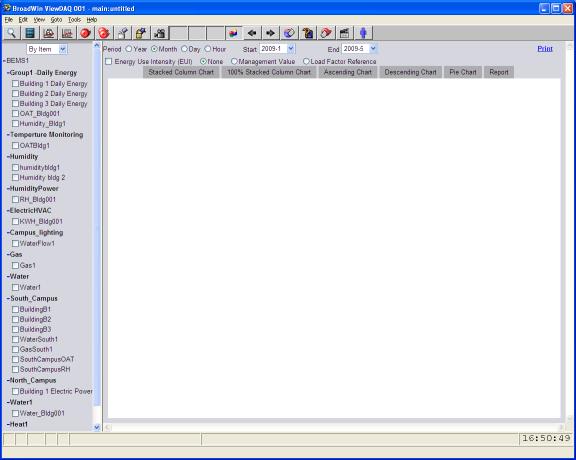
Figure 4.10 ViewDAQ – empty Energy Profile because no Items or Groups selected.
Select an Item or Group.
Select a time Period (Year, Month, Day, Hour).
Select Start and End Dates and/or times.
Select Chart type (Stacked Column, 100% Stacked Column, etc).
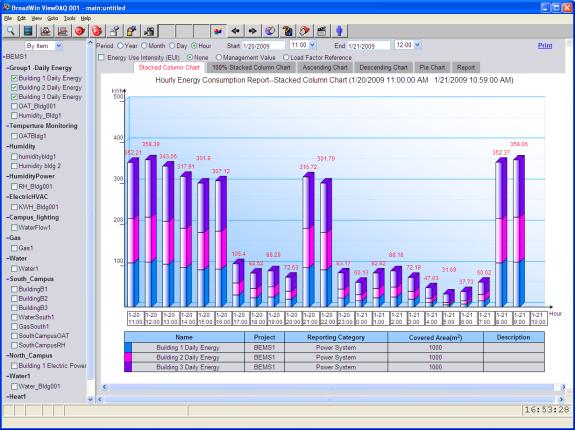
Figure 4.10 ViewDAQ – Energy Profile, 3 items, Hourly data.
To add items or change time, make the change and select the Chart Type tab again (Stacked Column, 100% Stacked Column, etc). The chart should redraw whenever the Chart Type tabs are selected.
To change the Analysis Display (Energy Profile, Energy Ranking, Energy Comparison, etc), use the toolbar menu again.