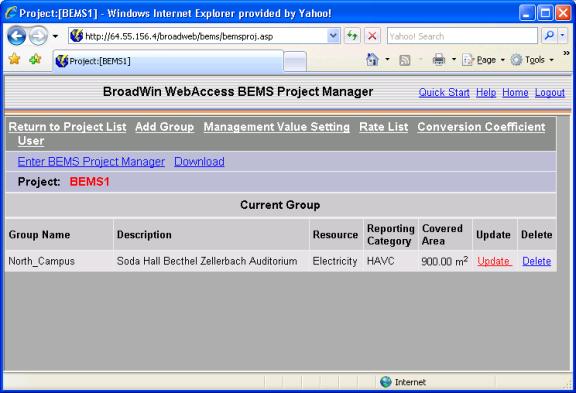
Figure 21.14 – Enter BEMS Project Manager – to view BEMS displays
After downloading a BEMS Project, you will have to wait at least 1 hour to allow data to collect. The smallest time interval displayed is one hour.
1. Select Enter BEMS Project Manager from the BEMS Project Manager (figure 2.14).
2. The BEMS viewer opens, usually with the Energy Profiles as the default.
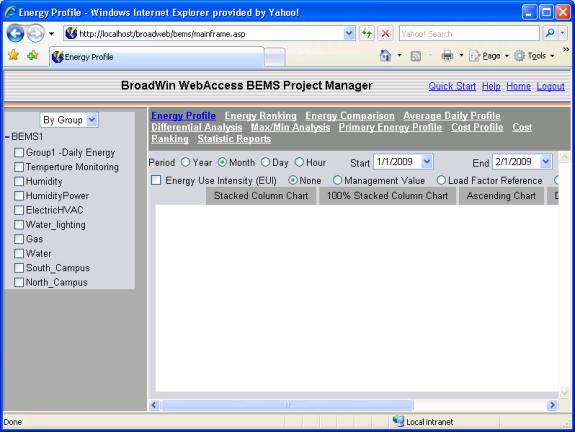
Figure 21.15– BEMS Viewer opened from BEMS Project Manager: Energy Profile
3. Select by Item to see a list of each Item configured fo each group. Note there are many more groups and items configured than just the North_Campus Group in the Quick Start example above.
4. Select the item (North Campus Building 1 Energy in the example).
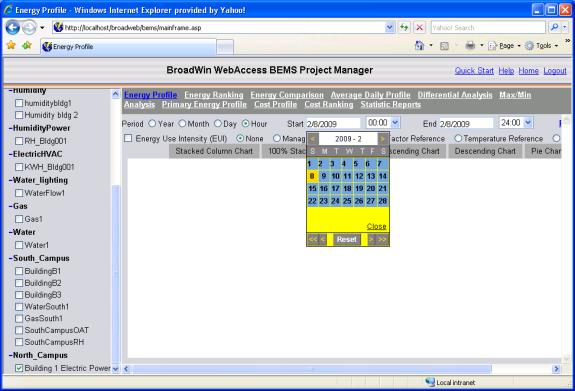
Figure 21.16 – BEMS Viewer – Energy Profile - Date Pull down menu
5. Select Hour for the Period.
6. Select Start Date and Time and End Date and Time.
7. Select Stacked Column Chart.
8. The Energy Profile appears.
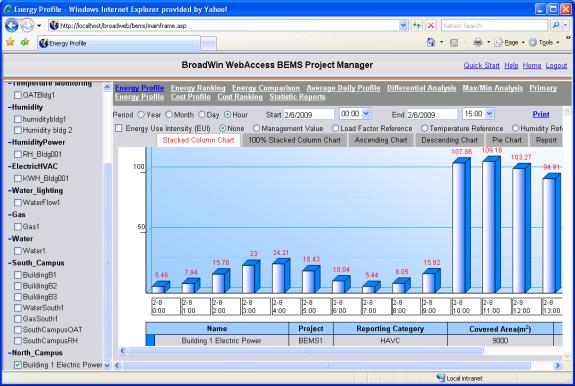
Figure 21.17– BEMS Viewer opened from BEMS Project Manager: Energy Profile
After downloading a BEMS Project, you will have to wait at least 1 hour to allow data to collect. The smallest time interval displayed is one hour.
The BEMS Analysis Displays are best viewed at 1280 x 1024 pixels resolution or greater. If your display resolution is less, then you may have to use the scroll bars to see all of the BEMS display.
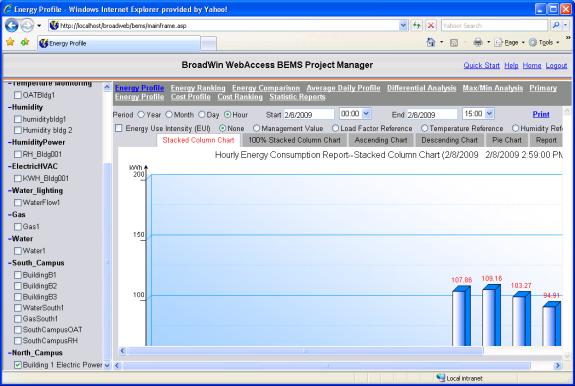
Figure 2.18- BEMS display on a 1280 x 800 monitor – Use Scrollbars to see all of the display