Demand Control is a licensed option per SCADA node. It will appear in Node properties even if you do not have the Demand Control options.
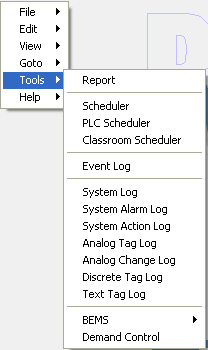
Figure 24.3.2 - Right Click Tools Menu shows if Demand Control License is available on the SCADA node
To open a Load Group Display, use the Right Click -> Tools menu in VIEW.
In ViewDAQ select Tools from the menu bar.
The Load Group List opens. Select the desired Load Group.
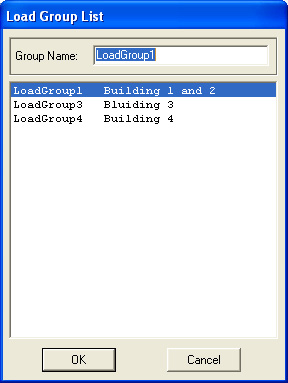
Figure 24.3.2b - Load Group List

Figure 24.3 - Load Group Display shortly after startup when lines easily labelled. 15 minute period
A Moving Window (also called a Sliding Window or Period) is used to calculate power usage continuously. The interval of this moving window can be specified, 15 minutes and 1 hour being commonly used. If 15 minutes, the algorithm works to ensure demand is less than Target Demand over the last 15 minutes at any 15-minute window in time (hence, the moving window analogy). The current moving window's KWH (Consumption) and KW (Demand) are shown in Red and labelled CP (Current Period). The Previous moving window's KWH and KW are shown in White.
Target (KW) and is shown in GREEN is the target not to exceed.
High Limit (in Yellow) is the Unload High Control Limit as a percent of the Demand Target. The High Control Limit is the actual not to exceed limit of the algorithm. Making it less than the Demand Target allows for unexpected surges in Power.
Low Limit is the Unload Low Control Limit are specified as a percent of the Demand Target. The Demand Control takes no action until Current demand exceeds the Low Control Limit. Below the low limit all loads are unshed (not in shed state).
Power of Current Interval is calculated from the KiloWatt-Hour meters. It is the integrated energy divided by the time of this interval (the demand period).
Shed Amount is how much is currently in the shed stae. This amount is based on the sum of energy savings estimate entered for each load in the shed state.
Power is the instantaneous power from the Active Power meter in KW.
Current Period is the Tracking Period specified in the Load Group and is for Display purposes only. Displays the KWH for the Tracking Period. It is either Daily, Hourly, Weekly or Monthly. Hourly is the KWH resets to 0 on the Hour. Daily, the KWH reset at midnight, etc. This is displayed at the bottom left of the Load Group Display.
Consumption is the KWH since the start of the Current Tracking Period (Hour, Day, Week or Month).
CP Demand is the Current Period power demand in KW. It is displayed in dark red on the Display. If the Demand Interval in the Load Group was configured as 15-minutes, then this is the KWH divided by15 minutes or KWH times 4.
PP Demand is the Previous Period power demand in KW. It is displayed in grey on the Display. If the Demand Interval in the Load Group was configured as 15-minutes, then this is the KWH divided by15 minutes or KWH times 4.
CP Consumption is the Current Period power demand in KWH. It is displayed in red on the Display. If the Demand Interval in the Load Group was configured as 15-minutes, then this is the KWH consumed over the last 15 minutes.
PP Consumption is the Previous Period power demand in KWH. It is displayed in white on the Display. If the Demand Interval in the Load Group was configured as 15-minutes,then this is the KWH consumed over the last 15 minutes.
Program controls the Demand Control algorithm its states are ON, OFF and Monitor Only. It is recommended to balance and shed loads manually before turning on Load Control if Demand is significantly above Target to avoid aggressive shedding by the algorithm on start up.
Shed Report is either Normal or Alarm. If the Demand Exceeds the Target the Shed Report state is Alarm.
Load Detail takes you to page two of the Load Group. This allows you to Lock, Unlock and Control Loads. ALso see the shed state of Loads. It is actually a the second page of this Block Detail display.
Below is a Load Group display operating in normal conditions. The lines all over lap aor a so claose they are hard to distinguish.
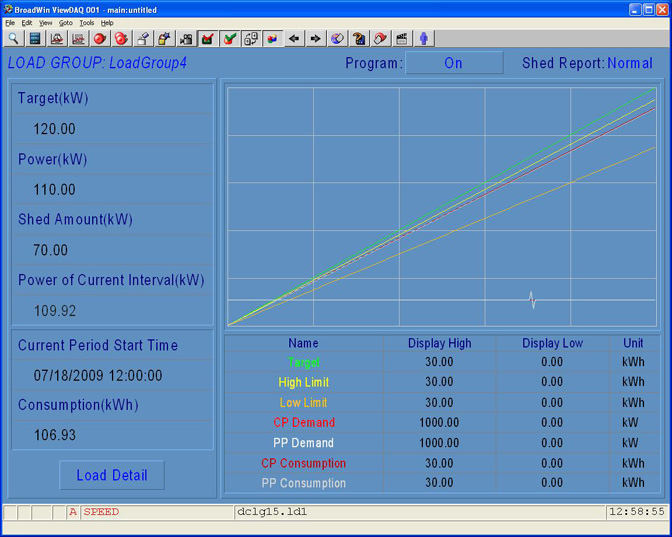
Figure 24.3 - Demand Control in Normal operation: High Limit, Current Period KWH and Previous Period KWH lines close or overlapping