 The Data Log
Trend Pop-up Dialog Box (F4) will list all these Data
Log Trend Groups automatically.
The Data Log
Trend Pop-up Dialog Box (F4) will list all these Data
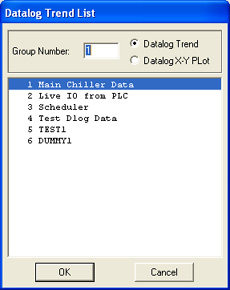
Log Trend Groups automatically.At least one DATALOG Trend Group must be configured to view Data Log values for all your Tags. Operators and users can add tags to this group or replace them "on-the-fly" in VIEW without loosing data.
The Data Log
Trend Pop-up Dialog Box (F4) will list all these Data
Log Trend Groups automatically.
Datalog Trends are plotted versus Time (the X-axis is Time). Similar to a strip-chart recorder.
Datalog X-Y Plots are plotted versus a selected Tag. Any of the twelve tags can be selected as the X-axis, the other 11 tags are plotted on the Y-axis. Data Log Plots are commonly used to show a relationship between two tags)
The groups provide a fast an efficient way to specific a large number of pre-built Display Trends with names that are meaningful to operators and ordinary users.
The Data Log Trend List can be called
using the <F4> keymacro, the Right-Click Menu or the
Data Log Trend icon ![]() on the toolbar.
on the toolbar.