The Trend Control can generate trend charts from any Text File that has the values organized in columns and rows. The columns should be separated from each other by special characters (usually the comma). Each sample (pair of values representing a point in the graph) is represented by a row (a line in the file). Suppose that the user wants to display a chart with the information in the following table:
| X Value | Y1 Value | Y2 Value |
|---|---|---|
| 0 | 0 | 10 |
| 1 | 1 | 20 |
| 2 | 2 | 30 |
| 3 | 3 | 40 |
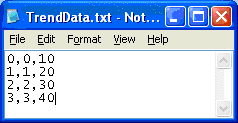
We have one variable that represents the X Axis and two variables (Y1 and Y2) that will represent different lines in the chart. The first step is to convert the data into a text file. If we adopt the comma as our separator the file will be as shown below:
We strongly recommend that you save the file in the same folder where the project is. By doing so, you do not have to specify the entire path and your project will still work, even if it is copied to a different computer.
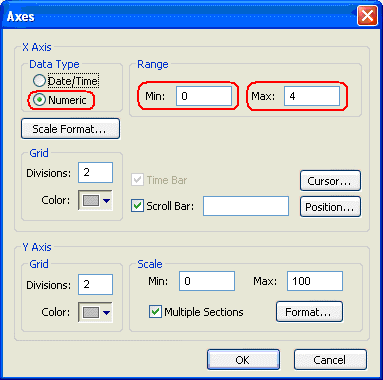
Once you have added the Trend Control to your screen, double-click on the object to open the Object Properties and click on Axis…. Change the Data Type of the X Axis to Numeric, and set the ranges as shown in the picture below:
Click OK on this window and then, in the Object Properties window, click on the Data Sources… button. The following window will display:
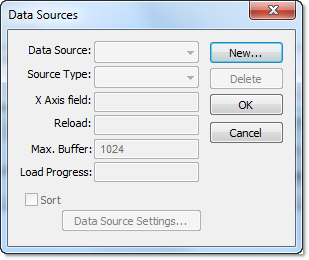
We need to create a data source in order to access to the text file. Click on the New… button, specify the Data Source name MyTextFile and then click Create. You should see the following information now:
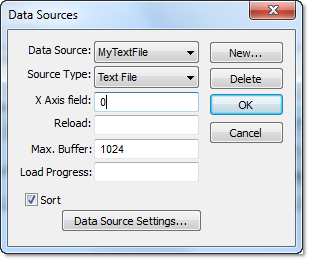
On the X Axis field we need to indicate which column in our text file represents the X Axis. In our example we are using column zero, so enter 0 for this field, then click Data Source Settings…. The following window will display:
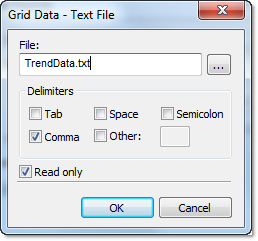
If you have copied the text file to the project folder, you only have to specify the file name, otherwise, enter with the complete path where the file is located (use the browse button as needed). Click OK on this window and OK again to finish the data source configuration and close the Data Source configuration Window.
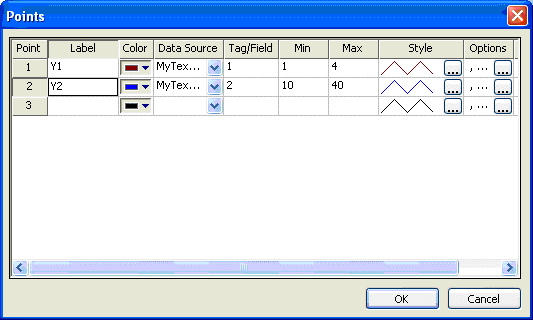
Now we need to define our Y1 and our Y2. They will be represented by points on our Trend Control. Double-click on the Trend Control again to access the Object Properties window and then click on Points…. Your next step is to define the points according to the following figure:
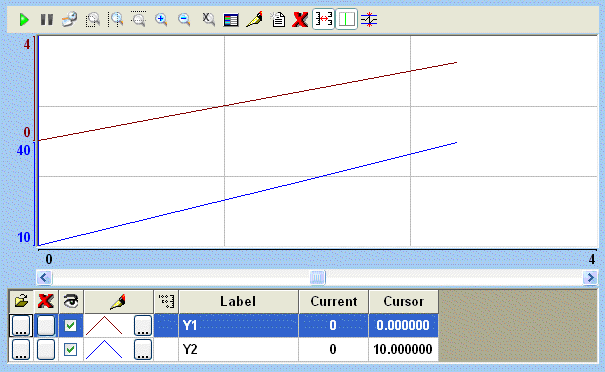
After following these steps, run your project and you should see something similar to the figure below: