The Trend Control can generate trend charts from any Relational Database that can be accessed through the ADO.Net technology. This Appendix illustrates how to access a Microsoft Access Database; if you are using another type of database, almost all the definitions will apply, however you will need to configure your connection on a different way. For information on how to configure other databases, please refer to the Appendixes in the Database Interface section of this manual.
Suppose that you have an access database at your C drive named mydata.mdb and that you want to generate a chart based on the information in the following table:

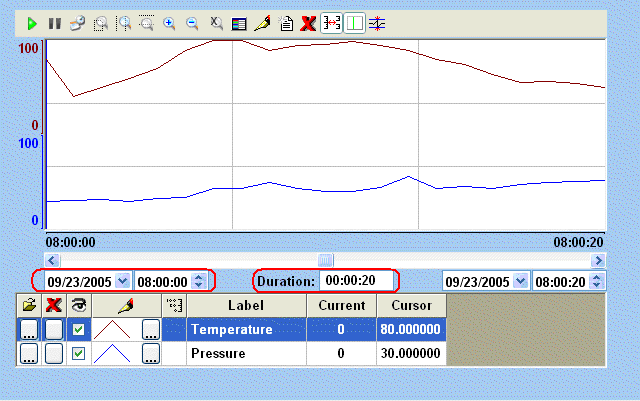
The first step is to add the Trend Control to your screen. Now double-click on the object to open then Object Properties and click on Data Sources…. The following window will display:
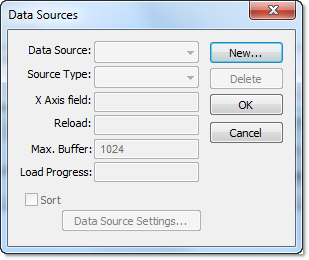
We need to create a data source in order to access to the database. Click the New… button, specify the Data Source name MyDB and then click Create. You should see the following information now:
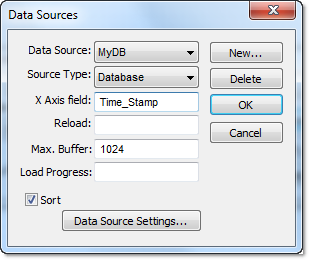
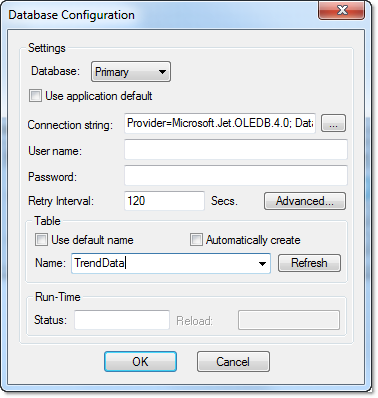
Change the Source Type to Database and specify Time_Stamp in the X Axis field. Then click on the Data Source Settings… button, the following window will display:

Uncheck the checkbox Use project default and click on the browse button … in order to configure the connection string. The following window will display:
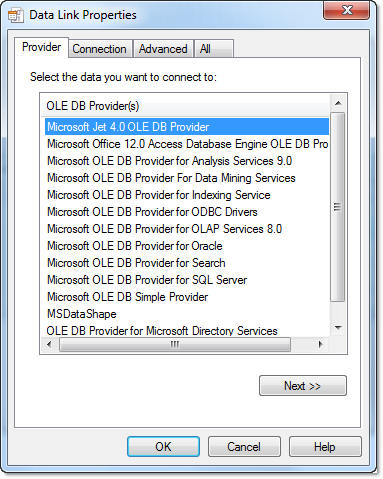
Select the Microsoft Jet 4.0 OLE DB Provider and click Next ». In the following window, you should specify the database path:
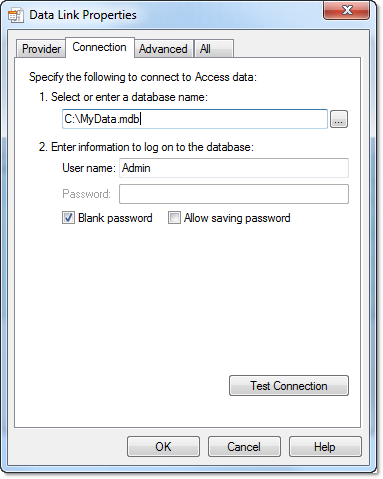
Click OK to finish the Connection String configuration. Now uncheck the option Use default name and select the table from your database as shown below:
Click OK on this window and OK again to finish the data source configuration and close the Data Source configuration window.
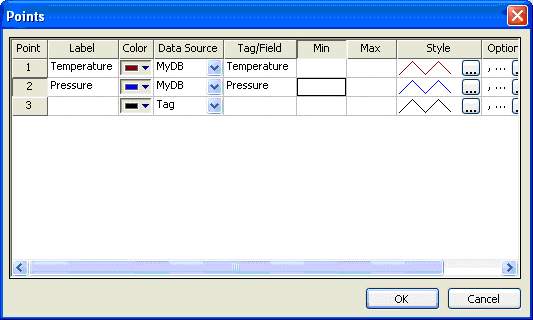
Now we need to define Temperature and Pressure. They will be represented by points on our Trend Control. Double-click on the Trend Control again to access the Object Properties window and then click Points…. Your next step is to define the points according to the following figure:
If you run the trend, it will start with the current date/time. In order to see the data in the chart you will have to properly configure the start date/time as shown below: