OR
1. Call up the Graph List Dialog Box by one of these methods:
a.
Select ![]() on the standard Toolbar (Figure 3.3)
on the standard Toolbar (Figure 3.3)
OR
b.
Use the Popup Menu (Figure 3.2) in a
web browser VIEW:
Right Click -> Goto -> Graph
OR
c.
From the ViewDAQ menu bar select: Goto ->
Graph
OR
d. Press F9 on your keyboard
2. The Graph List Dialog Box pops open (Figure 4.1 or Figure 4.2).
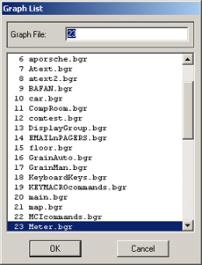
Figure 4.1- Graph List Dialog Box - in VIEW
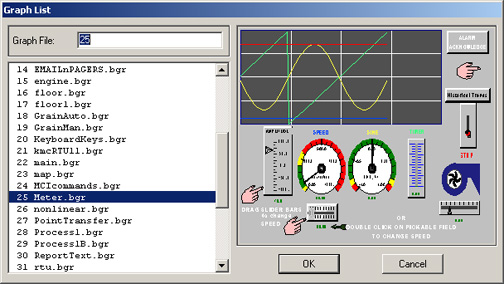
Figure 4.2 Graph List with PREVIEW in ViewDAQ (non-web browser)
3. Double click on the Graphic name in the Graph List Dialog (Figure 4.1 or Figure 4.2).
OR
Single click on the Graphic name and press OK.
For example, double click on Meter.bgr
4. The graphic display you selected appears. (Figure 4.10 shows an example from the LiveDemo of the Meter display).
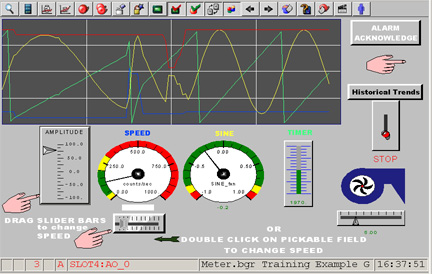
Figure 4.3 - user-built Graphic Display from Demo (named Meter.bgr).
Only user-built Graphic Displays with the *.bgr extension are listed in the Graphic List (sic "Graph List"). Note that the word "Graphic" is abbreviated "Graph" in most menus and dialog boxes.