Real-time data from tags can be recorded to central, ODBC-compliant databases on the Project Node and then viewed with HTML Reports using VIEW and ViewDAQ:
· Analog Tag Log (for floating point numbers)
· Discrete Tag Log (On/Off, run/start data)
· Text Tag Log
· Alarm Logs
· Action Logs
· A System Log is always generated and monitors who connects, downloads, Starts and Stops Nodes, and other "system access" information.
The Data from all SCADA nodes are recorded to the central Project Node databases.
Users can generate reports from these logs using a simple Query built from pull-down lists. The output of the HTML Reports can be copied and Pasted into EXCEL, WORD, and other general purpose office applications
In VIEW, Only Power Users and the admin account can access the HTML Reports. (All users in ViewDAQ can View HTML Reports).
In VIEW, to View Scheduled reports:
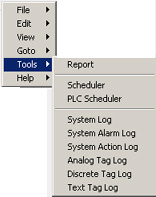
Right Click -> Tools -> System Log
Right Click -> Tools -> System Alarm Log
Right Click -> Tools -> System Action Log
Right Click -> Tools -> Analog Tag Log
Right Click -> Tools -> Discrete Tag Log
Right Click -> Tools -> Text Tag Log
Figure 5.43 - Right Click Tools Menu – Power User in VIEW
If the Tools Menu is “grayed-out”, then you are not a Power User. To login as another user in VIEW, you must close the Web Browser Window.
In ViewDAQ, from the menu bar select
Tools -> System Log
Tools -> System Alarm Log
Tools -> System Action Log
Tools -> Analog Tag Log
Tools -> Analog Tag Log
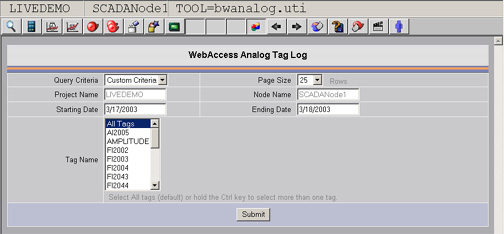
Figure 5.44 - Analog Tag Log Query display
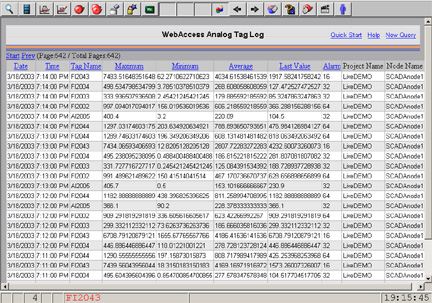
Figure 5.45 - HTML Report from Analog Tag Log
The DATA from these HTML reports can be copied and pasted into EXCEL, WORD etc.