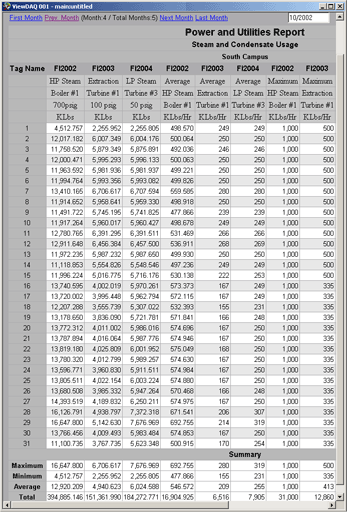

Figure 5.51 Monthly Report -ViewDAQ
The current Month’s report opens first in VIEW and ViewDAQ.
The Monthly Report consists 28 to 31 rows of data for each Day of the Month.
There can be 12 Columns per report (twelve tags). A Cell can represent the Daily Average, Day’s Last Value, Daily Minimum, Daily Maximum or Daily Total of the Tag’s value for the time-period the row represents (1 day).
Summary Data at the bottom of each Column can be calculated: Maximum, Minimum, Average and Total for the column.
If the Month is not complete, you will see blank rows of data for the future Days. Click Prev Month to see the most recent complete report if the current Month is not complete.
Emailed Monthly Reports appears almost identical, with Magenta and Blue borders.