The Alarm Summary shows all current alarms and all unacknowledged alarms. As alarms are "acknowledged" and "clear" they disappear from the Alarm Summary. An Alarm does leave the Alarm Summary until they are "Acknowledged" by an Operator. This is similar to Alarm Monitors in control rooms, commonly associated with Distributed Control Systems (DCS).
The Alarm Summary can be edited, so yours might look different (color, font, pushbuttons, etc.).
Power Users, General Users and the admin account can view the Alarm Summary through a Web Browser. Restricted users cannot view the Alarm Summary through a Web Browser. All users can view the Alarm Summary locally on the SCADA node using ViewDAQ.
There are at least four ways to View the Alarm Summary:
·
Select the Alarm Summary button ![]() from the Standard Toolbar (Figure
3.5)
from the Standard Toolbar (Figure
3.5)
OR
· Use the Navigation Popup Menu (Figure 3.2) in a web browser VIEW:
Right Click -> Goto -> Alarm Summary
· OR Menu bar in ViewDAQ: Goto -> Alarm Summary
OR
· Click a Pushbutton on a user built graphic with the <GOTO>ALMSUMMARY or <F5> keymacro
OR
· Press F5 on your keyboard
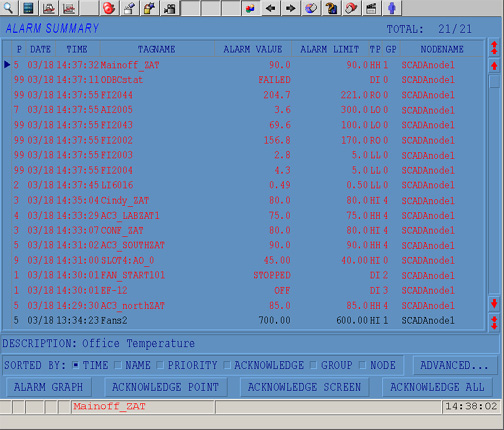
The Alarm summary can scroll to show up to 3000 alarms (16 at a time). The Priority, Date, Time of the Alarm, Tag Name, Node, Alarm Type, Alarm Limit, Alarm Value an Alarm Group are shown in the Default Alarm Summary
The Alarm Summary is "Global" and shows all alarms from all SCADA Nodes in your system. If the Project Node is off-line, the Alarm Summary will be blank.
Some Abbreviations are:
P = Alarm Priority (0 is no alarm and 99 is highest priority)
TP = Alarm Type (e.g. High-High, High, Low, Low-Low, High deviation, Low Deviation, Rate of Change or State)
GP = Alarm Group (0 is no group)