Real-time Trends are real time ONLY trend data. These are intended as temporary trend files. The Data in a Real-time trend lasts only long enough to fill the trend screen. Real-time Trends are ideal for Tuning of PID loops, where short-term data is needed only long enough to tune the Loop.
The time span is not adjustable in VIEW. The Time Interval is fixed when the engineer builds the real time trend in Project Manager. The time is a function of the time interval and number of samples.
Sample Rate for Realtime Trends range from 1 to 180 seconds. The Number of Samples in a Real Time Trend ranges from 60 to 480 samples.
If 1 second interval and 480 samples = 1 x 480 = 480 seconds
If 180 second interval and 480 samples = 180 x 480 = 86400 seconds
At least one RealTime Trend Group must be configured. You can add tags to this group or change them. Any Tag can be added to a Trend Group in VIEW (i.e. by operators and ordinary users in run-time).
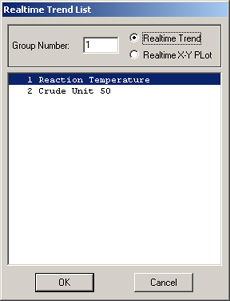
Figure 5.18 Real Time
Only Trend List
The RealTime Trend Pop-up Dialog Box will list all the RealTime Trend Groups, which can be viewed by:
Or F3 function key
Or a pushbutton with the <GOTO>REALTRD=keymacro.
Or the
Right-Click
Menu in a web browser VIEW
Right Click -> Goto -> Realtime Trend
Or from the menubar in ViewDAQ Goto -> Realtime Trend
Realtime Trends are plotted versus Time (the X-axis is Time), similar to a strip-chart recorder (Figure 5.19).
Realtime X-Y Plots are plotted versus a selected Tag (Figure 5.20). Any of the twelve tags can be selected as the X-axis; the other 11 tags are plotted on the Y-axis. RealTime Plots are commonly used to show a relationship between two tags)
The groups provide a fast an efficient way to specific a large number of pre-built Display Trends with names that are meaningful to operators and ordinary users.
Realtime Trends use a single Template Display that is pre-built and supplied with WebAccess. There is no graphics building required. Up to 12 Tags can be viewed on a single RealTime Trend Display.
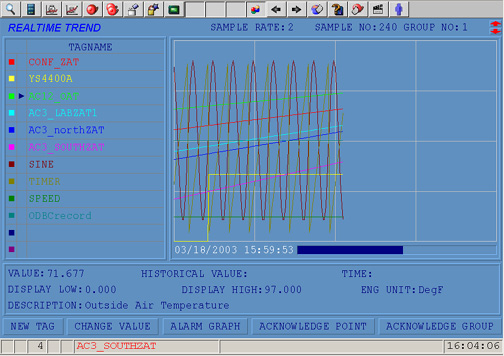
Figure 5.19 - Real Time (only) Trend Display
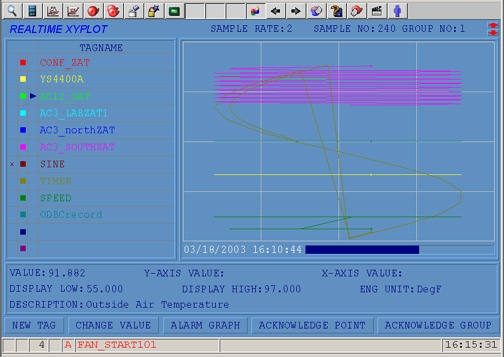
Figure 5.20 Real Time "ONLY" XY Plot
An engineer or technician can configure one of two Trend Display styles to change how the current Time and data displayed and how many time divisions and the time span across the trend:
Interval Shift - The current time is on the left axis, and trends updates in a shift of 1/4 screen (or the last division configured 1/2, 1/3, 1/4,or 1/5) when the end of the right end of the screen is reached. Until the last division is reached the screen updates continuously. The screen updates from left to right. This is the default.
Continuous Scrolling - The current time is on the right axis and the screen is updated each sample interval. When the end of the screen is reached, there will be a continuous line across the display. The screen updates from right to left. This mimics a strip chart recorder that has the pens on the right.
See Data Log Trends for a similar displays with more user flexibility regrading time span.