1.
Click the Widget icon ![]() from the Draw Toolbar (see A.2).
from the Draw Toolbar (see A.2).
2. Select $meter01 from the Widget File List (figure A.4).
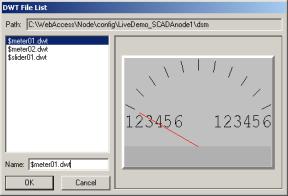
Figure A.4 - Widget File List Dialog Box
3.
Select OK. ![]()
4.
The TAG LIST appears (figure A.5).
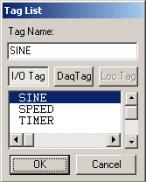
Figure A.5 - Tag List
5.
Select the DaqTag button ![]() to view all system tags
to view all system tags
(figure A.5). This list is always full of tags.
6.
Select the I/O Tag button ![]() to view all tags built by the user
to view all tags built by the user
(figure A.5). This list may be empty if there are no user-built
tags.
7. Select a TAG from the List (for example, SINE).
8.
Select OK. ![]()
9.
Position the Widget with the Crosshair. An outline of the widget is
superimposed on Crosshair (figure A.6).
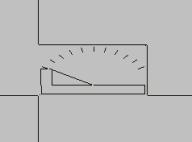
Figure A.6 - Crosshair with Widget outline
10. Click once to
Draw Widget (figure A.7).
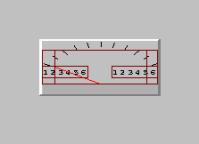
Figure A.7 - Meter Widget
Congratulations! You have just drawn and animated a meter that will indicate the value of your tag. The needle will move as the value changes. The High Scale and Low Scale of the Tag will be displayed.