C chart properties | Configuring a C chart | C chart calculations
The C chart is an attribute control chart that measures the number of nonconformities in each unit. Nonconformities data is the count of defects or discrepancies per unit.
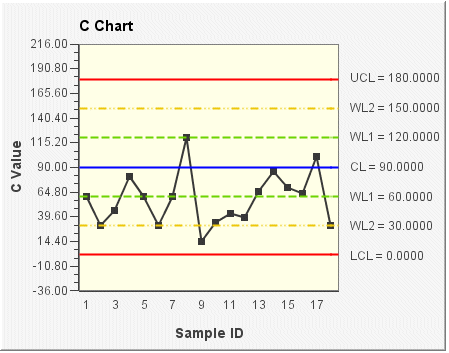
In the following C chart example, the y-axis shows the number of nonconformities in each sample subgroup. The control limits (shown on the chart as UCL, CL, LCL, WL1, and WL2) are set according to the VisualSPC data source.
