Individual chart properties | Configuring an Individual chart | Individual chart calculations
The Individual chart is a line graph that shows data points plotted in the order in which they occur. They are used to show trends and shifts in a process over time, variation over time, or to identify decline or improvement in a process over time. They can be used to examine both variable and attributes data.
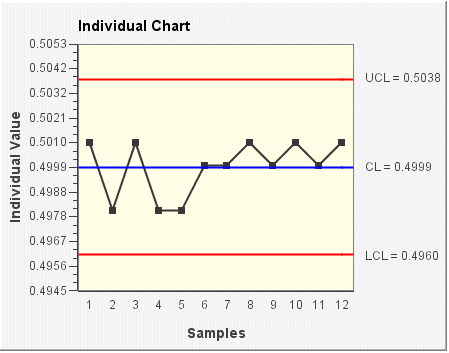
In the following Individual chart example, each individual sample value is plotted (the subgroup size is set at one and cannot be changed). The control limits (shown on the chart as UCL, CL, and LCL) are set according to the data and a sigma limit of 3.
