Np chart properties | Configuring an Np chart | Np chart calculations
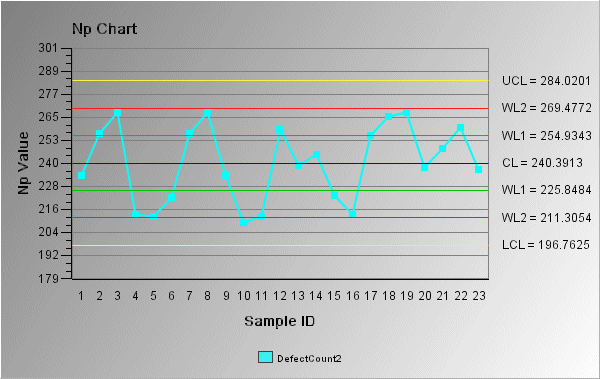
The Np chart is an attribute control chart that measures the number of nonconforming items in a sample of constant size. The Np chart is identical to the P chart, except that the actual number of nonconforming items is plotted, rather than the proportion of the sample. Also, the Np chart's sample size must be constant, while the P chart's samples can be constant or varied.
In the following Np chart example, the y-axis shows the number of nonconforming items for each sample. In this case, the sample size is set as a constant (1000). The control limits (shown on the chart as UCL, CL, LCL, WL1, and WL2) are set according to the data and a sigma limit of 3.