Sigma chart properties | Configuring a Sigma chart | Sigma chart calculations
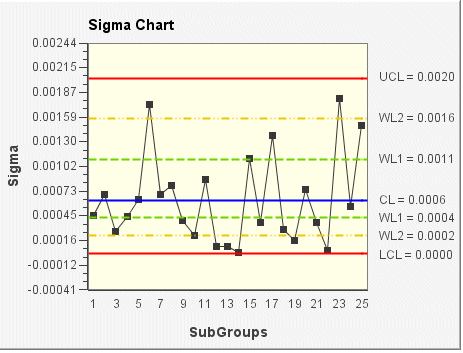
The Sigma chart, also referred to as an S chart, shows the Sigma (standard deviation) of subgrouped data. The sigma chart shows how the data is spread and is used to study system variability. The spread of a process is how far data points are distributed away from the mean (center). Standard deviation uses each individual reading to calculate variability; therefore, Sigma is a more efficient indicator of process variability than Range, especially with larger sample sizes.
In the following Sigma chart example, the subgroup size for the sample data is 5. The sigma (standard deviation) of each subgroup is plotted on the chart. The control limits (shown on the chart as UCL, CL, LCL, WL1, and WL2) are set according to the data and a sigma limit of 3.
