U chart properties | Configuring a U chart | U chart calculations
The U chart is an attribute control chart that shows the number of nonconformities (defects or discrepancies) that are found in a samples subgroup. U charts are the same as C charts, except that the U chart measures the average number of nonconformities from samples of variable or constant sizes, whereas C chart subgroups are the same size.
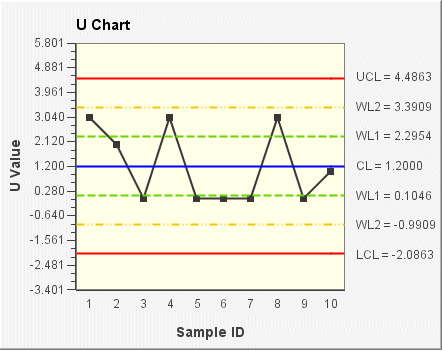
In the following U chart example, the y-axis shows the number of nonconformities in each sample subgroup. The subgroups are of variable size. The control limits (shown on the chart as UCL, CL, LCL, WL1, and WL2) are set according to the data and a sigma limit of 3.
