Using the XY Plot SmartObject dialog box, you can create an XY Plot Control that will display the data you specify during runtime. You may, however, want to modify and enhance your configuration. You can easily make modifications and enhance your chart without using scripts. You can either:
Re-open the XY Plot SmartObject dialog box by double clicking the XY Plot Control, or
Open the CIMPLICITY XY Plot Control dialog box, as follows:
Click the right mouse button over the XY Plot Control.
Select CIMPLICITY XY Plot Control Object from the popup menu.
Select Properties from the extended menu.
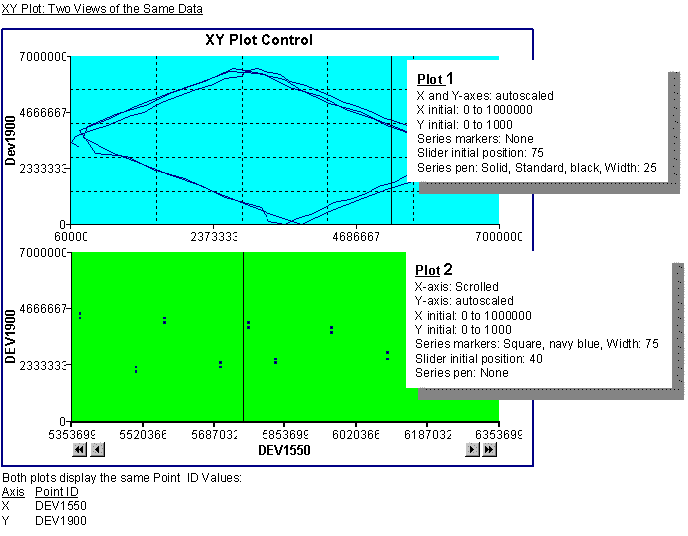
The following example displays two views of the same values.
Each chart was configured first in the XY Plot SmartObject dialog box and then enhanced through the CIMPLICITY XY Plot Control Properties dialog box.

A quick description of how to create each chart can clearly demonstrate how to use the XY Plot Control dialog boxes in order to quickly achieve the display you want. The examples were created to help you become familiar with the process. They include only a few of the many configuration options available to you.
The Point ID's used in the example are connected to a local PLC. You can use any Point ID that is active in your project.
|
About XY Plot SmartObject overview. |