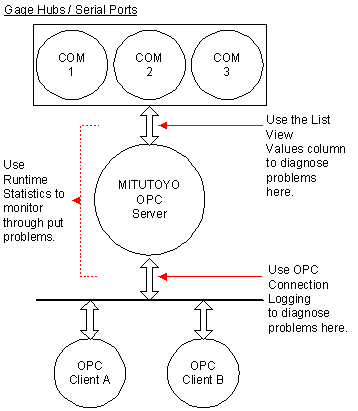
The GagePort Mitutoyo OPC Server provides troubleshooting tools to help a user diagnose specific aspects of a conversation between an OPC client and a gage tied to the serial port. There are three tools provided with the OPC server. Uses of the tool outputs are discussed in this section.
![]() The
Value column of the List View.
The
Value column of the List View.
When things are not right, this is the first place to check. By running the server interactively, then 'Starting' it, you can test communication with the gage hubs without having to connect with an OPC client. This way you can verify that the OPC server is communicating successfully with the gages.
|
OPC Connection trace logging. |
OPC-related connection information is captured using the Trace Logging diagnostic tool. This tool is used to log information about an OPC conversation (between a client and a server) to a text file.
|
GagePort Mitutoyo OPC Server runtime statistics. |
The OPC Server maintains OPC conversation run-time performance statistics. These statistics can be used to diagnose computer node performance problems and to tune OPC client reporting requirements.
The following diagram illustrates the scope of diagnostic information generated by each tool. The following sections describe the output from each tool and how to use it.

|
About OPC Servers. |